Thursday, December 24, 2009

Main stream and spinup data

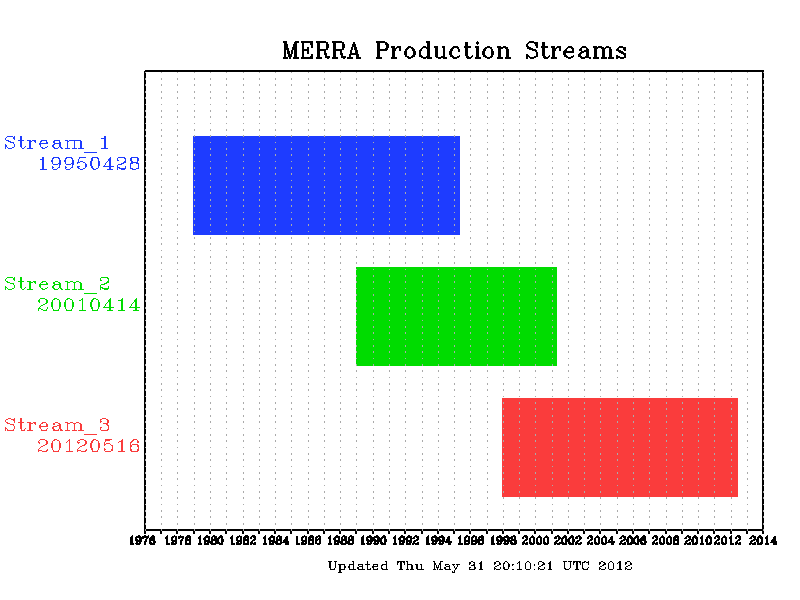
The original plan for MERRA production was to run in three streams, optimizing the computers processes. The original three streams were 1) 1979-1988, 2) 1989-1997 and 3) 1998-present. These were initialized with 2 years of coarse resolution analysis, followed by 1 year at the native (1/2 degree) resolution. Recently, streams 1 and 2 caught up to the beginning of the respective subsequent streams, connecting the time series. Streams 1 and 2 were continued providing overlapping data with the beginning of the next streams, in order to test the variance of the system and the viability of the initialization. At present, each of the overlapping periods are now 3 years duration (1989-1991, and 1998-2000).

We have been evaluating the initial conditions and the continued spinup of streams 2 and 3. In general, there are few differences in the meteorology between the overlapping data. In fluxes (such as precipitation), we do not a small difference at the beginning which gets smaller in time. The differences would likely not affect any scientific results. Slightly larger differences can be seen in slowly varying states, such as the root zone wetness.

At present we are documenting these differences and will provide a report on the overlapping period. In the mean time, this letter is provided to users to alert them that we will be changing the transition times of the streams to utilize the additional data produced at the ends of stream 1 and 2. This does not invalidate the data currently available, but is considered only a minor scientific revision. Once the data is provided to the DAAC and prepared for user access, the new streams and transitions will be as follows:

  • Stream 1 1979-1991
  • Stream 2 1992-2000
  • Stream 3 2001-present

Connecting these streams will be presented to users as the primary MERRA data, or the “main stream” data. Access to Stream 2 1989-1991 and Stream 3 1998-2000 data will still be provided, but the data will be considered secondary and called “spinup” data. This will effectively increase the spinup period for Streams 2 and 3 to 4 years of native resolution analysis.

We anticipate the transition from the original streams to this extended spinup configuration to occur in February 2010, nearly coincident with Stream 3 catching up to real time. Regular updates on this will be made after the holidays.

Have a wonderful Holiday Break!!


Wednesday, December 16, 2009

Accessing MERRA: Data Subsetter

This week, I needed a daily average surface flux subset of MERRA data. Locally, we have the 1 hourly data on a mass store system, but that is primarily archive, and not best used for routine analysis. The source data files are 269Mb each, and I needed one for each day from July 1987 through Dec 2007, which would have been a 2TB request. So, I used the MDISC to create data files specifically for the comparison from the Data Subsetter.

With the subsetter, I selected the 4 variables needed for the experiment, the time range (Jul1987-Dec2007, or 7489 days), the region could have been trimmed, but was left at the default (global). Daily averages, not the 1 hourly averages were preferable, so the the daily mean box was checked. HDF was suitable, so it was left at the default (as opposed to NetCDF, more formats may be added later). The subsetter provided a text file with the http links to the reduced data request. The links activate a program that does the subsetting and streams the requested data back. This text file is used as input to a Linux call to wget, which does the work of opening the http.

It took only about 16 hours (mostly over night), but the result was only 23Gb of disc space. The daily mean check box also saved me the time to process those daily means. Lastly, I did use the Mirador search to access and download one of the unaltered source data files, just to verify the variables and the daily averaging, and there was no difference between the Subset processed averages and daily averages computed manually.

The subsetter has evolved a lot over this past year, and additional functionality is planned. However, in it's present form, it should be a very useful tool in accessing MERRA data.

Friday, December 4, 2009

Water vapor feedback

An early decision in producing MERRA was to release data to the science community before the completion of the full time series, in the hopes that early analysis would provide insight to the data in a timely manner. In this months Journal of Climate, Dessler and Wong evaluate the water vapor feedback in the climate system using AR5 models, ERA40 and MERRA. The models and reanalyses all show consistent positive feedback (see the excerpt figure below). MERRA (point L in the figure) does show a bit more variability than the climate models (points A-J). A contributing factor to that variability may be a smaller number of years considered for MERRA, as the data was analyzed early in the production. Even so, the inclusion of MERRA in this research does help characterize the system and contribute to the understanding of its capabilities for climate research. At present, 1979 through Feb 2008 are approved for release at the MDISC data site.

Friday, November 13, 2009

Status and overlapping data

There was some scheduled downtime this week, and that slowed production, but December 2007 will be complete sometime this evening. 2007 data files are undergoing evaluation and should be released to the DISC next week, with 29 years of data available online.

Production on the first two streams continued an extra two years of data, giving three years of overlapping analyses for 1989-1991 and 1998-2000. The data at the end of the run should be much better spun up than that near the initialization, so those data are also going to be released at the DISC. Our evaluation of the overlaps and transition between data streams will be posted in time, as will documentation of the overlaps.

Friday, November 6, 2009

Katrina Quick Look

In looking at some land hydrology in the southern US, a question came up on the effect of the 2005 hurricane season on the hydrology time series. So, we started looking around at the evolution of Katrina. This animation shows the MERRA version of Katrina (13Mb gif) moving over the southern tip of Florida and through the Gulf of Mexico. The colors show precipitation in mm/day and the white contours are sea level pressure (contour interval 2mb). The Best Track location is plotted every six hours. Firstly, the MERRA closed low pressure follows the best track fairly well throughout the evolution. This is notable only in that while MERRA does assimilate observations every six hours, there is no relocating or bogusing routines involved with the analysis/forecast cycles.

The MERRA resolution (1/2 degree) is not fine enough to get at the mesoscale structures in hurricanes, and we see that in MERRA where the surface winds (not shown) only reach Category 2 on the Saffir-Simpson scale (observations and estimates of Category 5 occurred during Katrina). Likewise, the rainbands at a distance from the central low are not well defined. The animation shows a curious shift of the main rain fall from the southern quadrant to the north, as landfall occurs (see also the figure below). In trying to validate this, we found radar data at NCDC, presented is in the second plot below, which agrees with the MERRA distribution. However, and also likely related to the resolvable scales in the MERRA grid, the heaviest precipitation in MERRA is a larger distance away from the central low than observed.

While this seems like it is a reasonable representation of the real system, and likely useful, users must consider carefully the limitations in MERRA or any reanalysis data set when applying it to a project.


Figure 1. MERRA precipitation (color, mm/day) and sea level pressure (mb) at 12Z29AUG2005 with the complete NHC best track path for Hurricane Katrina.

Figure 2 Nexrad radar rainfall at 12:32Z29AUG2005.

Tuesday, October 20, 2009

MERRA, MAC and LandFlux

In a recent paper, Bosilovich et al. (2009) evaluate 8 operational analyses to better assess the uncertainty of the physical fields (not the assimilated states) derived form (re)analysis systems. During the first phase of the Coordinated Enhanced Observing Period (CEOP) 8 international meteorological analyses were collected for a common period, along with supporting satellite and in situ observations. The model data is called the Multi-model Analysis for CEOP (MAC). In general, it was found that the global precipitation and outgoing long wave radiation derived from an ensemble of analyses provided fields that more closely resemble available observations than any one of the members.

For certain physical quantities, such as surface evaporation, a reliable method of observation is not available, and international projects such as SeaFlux and LandFlux are being developed to best fill the gap. In some research, data from analyses and reanalyses are taken as a substituted for observations. The figure below shows the MAC ensemble members compared with the ensemble mean. In places, there is as much as +/- 75 W/m^2 differences among systems. Comparison with such a data set can clearly identify outlying systems. Also, for certain research, using the physical fields from a single system may not be adequate.
Caption: MAC version 2 systems Latent Heat Flux differenced from the ensemble mean for July 2004. Version 2 includes the MERRA and ECMWF ERA Interim reanalyses in addition to the version 1 data. Mean and standard deviation of the difference fields are provided in each panels title.

More information on MAC and the data download are available.

Bosilovich, M.G., D. Mocko, J.O. Roads, and A. Ruane, 2009: A Multimodel Analysis for the Coordinated Enhanced Observing Period (CEOP). J. Hydrometeor., 10, 912–934.

Tuesday, October 13, 2009

Status and some recent analysis

Data at the download site are now continuous from 1979 through December 2006. To date, the data volume is approaching 70Tb, and in September alone, 5.7 million files totaling 91Tb of data were served.

Production continues toward real time, and June 2007 is halfway complete. The throughput is approximately 1 year every 6 weeks, so the production should catch up to real time in early 2010.

An overview of MERRA, including some recent results were presented at Purdue University Department of Earth and Atmospheric Sciences. This includes some evaluation of the global water and energy clycles and processes, however, the analysis continues and a peer review manuscript is in preparation. So, use these results accordingly.

Wednesday, August 5, 2009

AMS Annual Meeting, Jan 2010, Atlanta

The absttract deadline for the 24th Conference on Hydrology has been extended to Aug 10. Of note, abstracts regarding "Hydrometeorological representation and applications of reanalyses" are sought. The full list of conferences, themes and topics can be found at the AMS WWW page.

Tuesday, July 28, 2009

Further Production Update

Stream 2 has past the end of Dec 1997 and stream 3 has past the end of Dec 2005, so that we now have a time series from Jan 1979 through Dec 2005. The 1997 and 2005 data are still being assessed for quality, and should be posted at the MDISC site by then of the month or no later than early August.

Monday, July 13, 2009

Production update

Stream 1 has completed Jan 1979 through Dec 1988, catching up to the beginning of Stream 2. The reamining Stream 1 data will be released to the the download site within a week or so. Further, we are conituing Stream 1 for two additional years in order to study the initialization of Stream 2, and evaluate the transition of the data between the two streams.


Stream 2 should catch up to the begining of Stream 3 by the end of July. We we conduct a similar evatuation of the transtion between streams there as well.

Stream 3 production is on hold, pending a fix to allow for a format change in some of hte input data. It will resume ASAP.

Thursday, June 18, 2009

Land Interaction Processes


MERRA Production has been moving along steadily, still on track for a continuous time teries (1979-2006) to be available in early August. Data (missing 1988, 1997, 2005) is presently available for download, see the MERRA home page for access information.

With much of the record available, comparisons to previous studies of reanalyses are possible. For example, there has been a lot of work on the land interaction processes in NCEP and ERA40. Betts and Viterbo (2005) has defined cloud albedo as an observable diagnostic of the all-sky radiative forcing of the surface (Acld = -{SWDNsfc-SWDNsfcclr}/SWDNsfcclr). Below is an example of the cloud albedo comparison for ISCCP and ERA 40 over the Madeira basin, followed by a similar figure for MERRA. ERA40 tends to overestimate the cloud albedo, while MERRA underestimates it. This indicates that for the Madeira, the shortwave at the surface is
too close to the clear sky values. This bias is especially pronounced during the austral winter and less so in summer.


In evaluating the coupling processes, the links between the surface, surface layer and boundary layer relate to precipitation. Below, Betts (2009) shows the relationships of boundary layer (through LCL height in pressure thickness), surface layer (EF, evaporative fraction) and soil wetness (SMI). While lower wetness is often and indicator of higher LCL and lower precipitation, there is a range in the characteristic values. EF results are similar. The LCL - wetness connection in MERRA appears stronger and more linear than that of ERA40, where the MERA LCL height is almost double that determined from ERA40. (Note that the soil moisture index in Betts 2009 is not the same as the MERRA surface soild wetness, the SMI cannot be easily reproduced in MERRA data). The MERRA relationship between LCL and EF is much tighter than that shown for ERA40.


In the figures above, the colors indicate the amount of daily preciitation that occurs relative to the LCL and Wetness/EF values. For the MERRA figures, the dots are each daily mean showing the range in the data, and for ERA40, the range it demonstrated by the error bars.

Betts, A. K., 2009: Land surface coupling in observations and models. J. Adv. Model. Earth Sys. Articles in Press.

Betts, A. K. and P. Viterbo, 2005: Land-surface, boundary layer, and cloud-field coupling over the southwestern Amazon in ERA-40, J. Geophys. Res., 110, D14108, doi:10.1029/2004JD005702


Friday, May 22, 2009

March 1993 East Coast Snow

Recently, Midshipman S. Martin from the United States Naval Academy visited the GMAO, to learn about MERRA. The specific case study evaluated for a brief internship was the March 13, 1993 east coast snow storm (links to a recent Capital Gang discussion on the predictability of the storm). This was just a preliminary evaluation of how MERRA analyses represent the storm, in preparation for a senior paper.  As with the Feb 1979 storm (see the MERRA home page), we generated an animation (~8Mb) to get a sense of the storm track. 


Snowfall totals of 2 feet or more occurred at many observing stations. Below, the snowfall totals from Kocin et al (1995) are compared with MERRA. The northern extent of the heaviest snow seems to be a bit weak (in NY and western PA, for example) . The MERRA snow data was converted from snow water equivalent accumulated for the two days, and converted to snow depth using 10% snow/ice density.

At 12Z13MAR1993, the surface low was centered over Georgia, with the surface front extending southward through Florida. Aloft, the main part of the jet stream was North of the surface low, but a maximum in wind speed (likely a jet streak)was in the 300mb trough, lagging behind the surface front (below).

Looking closer at the vertical cross section through the trough and this wind maximum, we find a well defined tropopause fold associated with the 300 mb wind maximum. Below we compare the MERRA representation of the tropopause fold to a case study (1978) observed with aircraft measurements. The MERRA figure shows wind speed in black, potential temperature in dashed red and potential vorticity in shaded blue.


The main point here is that the MERRA analysis of the storm shows good dynamical structure of a very strong storm. More still would need done, evaluating the cyclogenesis, and how well the system physical processes through the lifecycle of the storm. However, this is one of the stronger examples of cyclogenesis in the MERRA period, and so another question is whether MERRA data can reproduce the dynamical structure of weaker storms. Ultimately it's a promising result so far.

Figures obtained from:

Keyser, Daniel. “Atmospheric Fronts:An Observational   Perspective.” In, Mesoscale Meteorology and Forecasting, 216–257.

Kocin, P., Schumacher, P., Morales, R., and Uccellini, L. (1995, February). Overview of the 12-14 March 1993 Superstorm. Bulletin of the American Meteorological Society, 76, 2, 165-182.


Friday, March 6, 2009

Mt Pinitubo Eruption Summer 1991


The eruption of Mt. Pinatubo in June 1991 was the second largest terrestrial eruption of the 20th century (Novaruption in 1912). This eruption ejected massive amounts of aerosols in the stratosphere. While global surface temperature dropped in the subsequent months, this caused an overall warming of the stratosphere in the tropical latitudes by several degrees due to absorption of radiation by the aerosols. Here, MERRA monthly means of 70mb temperature from August and then December of 199o are subtracted from August and December of 1991 to show that stratospheric warming by about 2 to 4 degrees C as the ejecta traversed the globe at this level during the subsequent months after the eruption.


Friday, February 27, 2009

Feb 19, 1979

The 1979 President's Day snow storm was a significant snow event in the North eastern US. This article presents an interesting review of the impact on the DC region and the modeling capability of the time. With the 30th anniversary of this storm, an animation of the MERRA depiction has been posted on the main WWW page. Here, we just compare a snapshot of the reanalysis to GOES IR imagery. The interesting part is that there is a clear break in the cloud structures of the storm develops over the Atlantic. This is not as apparent in the visible imagery (more like a continuous comma shape). MERRA cloud cover seems to catch this aspect of the storm. This data comes from the assimilation cycle of the system, forecasts for this case have not been run, but may be interesting.

The current estimate for when MERRA will catch up to real time is Fall 2009.

The MERRA cloud data is contoured from no cloud (black) to complete cover (white), the mean sea level pressure is contoured in purple. Wind barbs are colored according to the magnitude of the wind speed, and only 1 in 4 grid points are plotted.

For a study of the event, see: Bosart (1981)

Tuesday, February 24, 2009

MERRA Workshop Materials

The presentations from the MERRA Workshop have been posted on line at: http://gmao.gsfc.nasa.gov/research/merra/presentations/index.php

Also, the materials from the workshop, including documentation and software (Grads, with online access to the data) are also available online:

ftp://gmaoftp.gsfc.nasa.gov/pub/papers/mikeb/MERRA_Workshop/

Sunday, January 11, 2009

AMS Annual Meeting - MERRA Short Course

Today, January 11, we hosted the short course on MERRA and data access. We had 15 attendees from a variety of backgrounds, research and applications, universities and government. Also, there were a range of experiences, some familiar with reanalyses some no prior experience. Our objective was to provide the basic understanding of the system, how we validate and use the data in research and how to access the data (with traditional methods, and newer online software access).

The day started with and overview of the project and the GEOS5 data assimilation system by Michele Rienecker. Michael Bosilovich presented an overview of the validation prior to starting the reanalysis and the current description of the hydrological cycle and global energy budget. Steve Berrick described the access to the data and the various portals at the MDISC. Arlindo da Silva gave a wide ranging presentation on how many different software packages can access MERRA online data.

We were pleased to have Alan Betts give a lunch time presentation covering much of the work he has done over the last 10 years working with ECMWF reanalyses data. The afternoon was reserved for some hands on data analysis and processing activities. We provided digital handouts including many of the presentations but also some software and data that the attendees could run on rented laptops (or their own).

The first hands-on exercise was reproducing some of Alan's figures of ERA land atmosphere interactions except with MERRA data. Next Arlindo da Silva discussed the regridding and reformatting of reanalyses data with the theme of "Look-Alike" imitation. In other words, making MERRA look like NCEP reanalyses (or any other reanalysis) for comparison or reading into existing software applications.

One theme of the meeting was processing data online, not downloading data, but producing the answer with online utilities. This was primarily through GrADS Data Servers (GDS) . The Look-Alike hands-on activity included a walkthrough where participants created MERRA data files from the online data servers using a command line utility (lats4d). Following that, Michael Bosilovich showed examples of using serverside calculations to improve the efficiency of online GDS calculations.

Lastly, Dana Ostrenga of the GSFC MDISC demonstrated the Giovanni access and evaluation of MERRA data, including the along track (satellite track) utility soon to be released. This will allow comparison of MERRA vertical sections compared to A Train data, such as Cloud Sat.

We are currently preparing the materials (including software and presentations) for WWW distribution and will post a message here when they are ready. The networking and online data servers performed well during these exercises.