Sunday, November 9, 2008

MERRA turns 11, Global Energy Budget

Last week, MERRA had produced 11 years of data across all 3 streams (79-82, 89-92 and 98-00). Here is a quick evaluation of the global energy budget so far. The reference values are a recent update from Trenberth et al. (2009, BAMS accepted DOI: 10.1175/2008BAMS2634.1). There is a difference between MERRA and this reference, where MERRA is averaging all 11 years, while the reference data was developed from theory as well as observations and reanalyses from March 2000 - May 2004. MERRA is presently in 2001, so it will be a couple months before we can reproduce the global energy budget for this exact time.

(In the figure, MERRA data includes 130 months written in red)

At the surface, too much shortwave, and not enough longwave reach the surface, while at the top of the atmosphere, too little shortwave is reflected and too much longwave is emitted. This suggests that the cloud fraction is too low or cloud optical properties too thin (or both). It is interesting to note that the values tend toward improving in time toward the 2000s. A discussion on the trends in the global energy budget is being prepared.

Some other interesting features occur. The overestimate of the shortwave energy (primarily over the ocean) into the surface is not translating into increased sensible, latent or upward longwave fluxes. Instead, it contributes to the imbalance at the surface, and since the SSTs are prescribed the surface is not warming. Also, the difference of precipitation and evaporation reflect the influence of hte analysis increments on the water budget (globally taking water out of the system).

Trenberth et al (linked above) provide more discussion on the global budget, as well as comparisons to the NCEP and JRA reanalyses.

Friday, October 17, 2008

Severe Freeze in South America

While looking over the area average time series of the Amazon River basin produced by MERRA, a very cold event was apparent in July 1981. Figure 1 shows the time series of 850 mb temperature for the basin, and the event is several K colder than earlier in the reanalysis. The cold event starts around July 16 1981, and lasts a few days. Looking at the observation reports from this period, did not show any major problems with the input obs, yet the analysis increments of water vapor show a strong shift, starting with this event (Figure 2). So, the shift in the increments along with the temperature spike suggests, at first glance, a problem. However, the lack of rejected observations or increased error in the forecast says the observation and assimilation are OK.

While considering the problem, Austin Conaty used Google Scholar to search for cold events in the Amazon. It turns out that there was a strong system pushed northward across the continent bring cold air and a freeze to Brazil (Fig 3 from Fortune and Kousky, 1983). By looking at the Amazon Basin area average, we see the cold anomaly push into the basin. While it looks out of place, it is a real feature. We'll file this under, you learn something new every day.

Figure 1 Time series of Amazon basin average 1 hourly 850 mb temperature (K) for 1979 through 1981. The July 1981 cold anomaly stands out in this relatively short time series.

Figure 2 Time series of area averaged analysis increment of water vapor daily averages (dqvdt_ana, mm/day) for the Amazon basin from May 1981 through Sept 1981. As the cold air enters the region, the analysis increments shift (becoming smaller negative values).

Figure 3 Synoptic maps of the cold air event, brining a sever freeze to Brazil, copied from Fortune and Kousky (1983, MWR).

Friday, October 10, 2008

Known Issue #1, east Atlantic anomaly

Recently, an evaluation of the global energetics identified an anomalous feature, a bullseye, off the coast of Portugal during most of 1979 and 1980. The anomaly affects many tendencies and variables in this localized region. Figure 1 shows the JJA 1979 Analysis Increments of temperature at 500 mb, the center of the strong negative increment is a persistent radiosonde that appears to be flawed, compared to other nearby sondes. However, it was not rejected by the data assimilation's quality control. The sonde itself is being researched as to whether it is mislocated or just poor quality. Regardless, 1979 and 1980 data have a localized problem. The data will still likely be made available, as other regions around the globe, and certain global parameters are not as dramatically affected. However, we will try to alert users to this issue, as it will affect any investigation of the weather in the eastern Atlantic Ocean or possible western Europe (Figure 2).

The current plan is to re-run the affected period at a later date, however, that re-run will not replace the existing data, but be placed alongside the existing data. We will continue to use and evaluate the current 1979 and 1980 data, and if other issues arise, fixes could also be incorporated into the re-run. Also, with this problem, a new page will be created for the MERRA WWW site to catalog issues with the data as they arise, and include any actions to those issues.


Figure 1 JJA 1979 analysis increments of temperature (DTDT_ANA). The questionable sonde is causing the negative increments circled.


Figure 2 Temperature differences (MERRA-JRA25) at 850 mb for JJA 1979. The low temperatures resulting from the questionable sonde are apparent west of Portugal. The featuer is also apparent in the surface pressure fields (not shown)

Friday, September 26, 2008

Integrating Earth Observations

One of the advantages of reanalyses is that many different sources of observations are combined in a global gridded consistent system. We have a brief overview of MERRA and the challenges facing reanalyses published in the online IEEE magazine Earthzine www.earthzine.org. There are a number of interesting interviews and articles at the site as well.

Tuesday, September 23, 2008

MERRA Short Course at AMS

We will have a short course at the AMS Annual meeting January 11 in Phoenix AZ. It will cover an overview of the system and physics, the validation that we have already done, but the most important and interesting component will include several hands on tutorials working with data online. Given that the volume of data will be quite large, the subsetting and previewing tools should be useful to researchers to target the data they require. The audience will likely be graduate students or researchers who work directly with the data. Several tools that are used regualrly at the GMAO to manipulate the data, formats and grids will be demonstrated.

The announcment is on this page: http://www.ametsoc.org/MEET/annual/call.html and the registration is currently open. The AMS will shortly publish an agenda, and we are currently working on adding more details to that regarding the tutorials.

While MERRA won't be completed by then, it will be nearly halfway complete. Also, by then data will be accessible online.

Friday, September 5, 2008

Status and File Spec

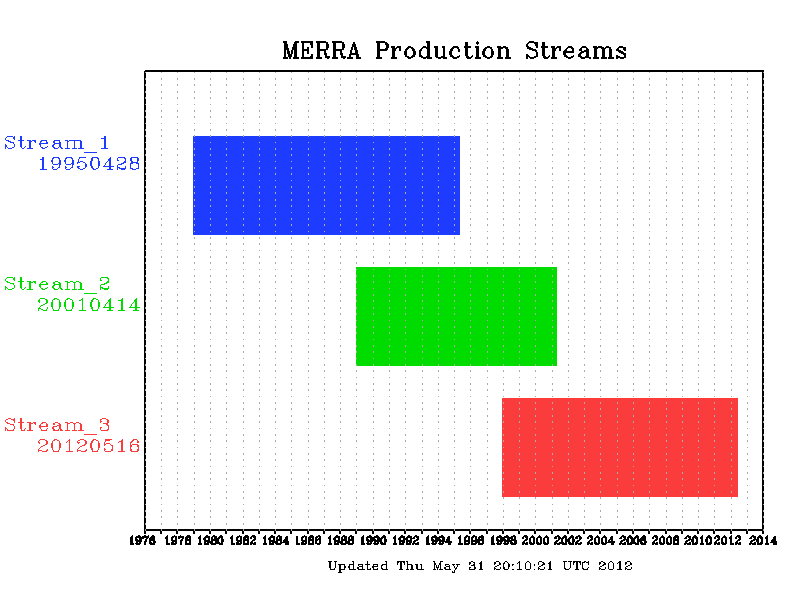
Production of MERRA data has been progressing at 10 days per day on three streams, which is what is expected. Data monitoring is going on regularly, and the system seems to be moving along at the expected data quality. We have some time series routines being run, and will report on those when we achieve 8 full annual cycles. Currently, Streams 1 and 2 have more than 2.5 years each, and stream 3 has 22 months.

The MERRA File specification document has also been updated and reflects exactly the data files being produced. The document can be found at the bottom of the MERRA home page, and a link is provided here.

Wednesday, July 30, 2008

MERRA mail list

A mail list has been established to pass on news and alerts regarding MERRA especially the data. Send an email to majordomo@listserv.gsfc.nasa.gov with the body of the message "subscribe merra-news"

You will receive a message with instructions to confirm the subscription.

Friday, July 25, 2008

AMS Annual Meeting - Abstract deadline Aug 1

There is a planned session on reanalyses at the AMS Annual meeting, co sponsored by the Committee on Hydrology and Climate Variability and Change Committee. The deadline is August 1. Please see the call for papers:
http://www.ametsoc.org/MEET/annual/index.html

Thursday, July 17, 2008

Status July 17

Late last week, the computing platform running MERRA was brought down for scheduled maintenance including an upgrade to the operating system. When it was brought back online, numerous scripts and control jobs for MERRA were broken. The science and executables for MERRA remain, but the control of jobs and data flow needed to be patched for the new OS. At this point, the three MERRA streams are processing forward. However, some post processing scripts are still being patched, such as the information on our Production Progress and Quick View pages. Those should be back on line in a few days.

Tuesday, July 1, 2008

Brief Comparison with Interim Reanalysis

Recently the ECMWF Interim reanalysis has been released (see http://data.ecmwf.int/data/). We have a quick overlap and look at a comparison with MERRA at monthly time scales for January 1998.

The figure below shows two features of the MERRA system we have been tracking since the system was under development, 1) negative zonal wind bias in the tropics and extratropics and 2) dry bias in the lower troposphere, especially the tropics. These are apparent against each of the existing long reanalyses (see the quick look page for more comparisons). However, in comparing ERA40 and the new Interim reanalyses with MERRA, the magnitude of the differences is smaller compared to Interim.

At this time monthly files are not available on the ECMWF site. When those become available for download, we will integrate the Interim data into the quick look pages for comparisons.


(Gary Partyka, GMAO, downloaded the Interim data and performed the comparison and evaluation.)

Sunday, June 15, 2008

Status June 15

Just a brief update. The updated sonde fixes seem to be going well. The restarted Stream 3 is into March 1998, and we have evaluated the early data. Stream 1 has completed 1979, and Stream 2 will complete 1989 in a day or so. While their has been scheduled downtime for the computing system (Discover), recent upgrades have paid off with 11 days/day of throughput per stream.

Sunday, June 8, 2008

Status June 8

Streams 1 and 2 have been progressing, and full years should be available by the end of this week.

Stream 3 was held for the revision to the sonde data (station identifiers and launch times, see the May 23 post). However, it was decided to restart from January. Stream 3 is presently restarted and at Jan 11 1998.

Thursday, May 29, 2008

MERRA Quick View

We've just opened a new link on the MERRA WWW page. It is a version of what our monitoring team is using to look quickly at various aspects of the circulation and water cycle. We'll be adding some other figures, like time series of the monthly data as well.

http://gmao.gsfc.nasa.gov/research/merra/prequel/view.php

Friday, May 23, 2008

Status May 23

All three runs streams are progressing forward, 5 months in, approximately. However, as some folks here were making corrections a few weeks ago there were some unusual reports in the sonde data. Further investigation has found a problem that is fairly easily correctable. Actually there are two problems, and they change in time.

Starting around 1988, the actual launch time isn't being considered, just the synoptic time of the launch. From 1988-1992, this occurs in less than 1% of the launches at any given synoptic time. After 1992, the rate increases to around 10-15%. The consensus is that the impact to the 1989 MERRA stream is small, and we can have this fixed by the time we cross 1992. However, in 1992, a more serious problem occurs. Then, some sondes are not labeled correctly as to their manufacturer. This then affects whether the radiation correction for certain sondes is called, and the radiation correction is important to handle correctly. This occurs at a rate of about 15% at any given synoptic time, also a fairly large number. Again it can be corrected for the 1989 stream, before it gets serious.

The 1998 stream is another matter. Both of these problems are occurring at a rate of about 15% per synoptic time in January 1998 and on. So, the data we have processed for the 1998 stream has a flaw than needs to be corrected. In order to stay timely with the MERRA processing, we will continue the 1998 stream to 1 July 1998, at which time the fixed sonde data will be implemented. The Jan - Jun 1998 data processed so far will not be released. Instead, we will continue the 1989 stream to recover this period, and there will be overlap through 1998 to ensure that the transition of streams is as smooth as possible.

A word about the source of this error. We are using recently reprocessed sonde data from NCEP, and working with NCEP closely on monitoring and quality controlling this data. This is the data set that would also go into the NCEP CFSRR, but is not the same as has been used in previous reanalyses.

So in summary, there is no impact on the 1979 data stream. The extremely small number of launch time errors early in the 1989 stream are considered to be nominal, and the sonde data will be fixed as soon as possible. The 1998 data from Jan - Jun must be redone. The fix to the data will be implemented on Jul 1998.

Monday, May 19, 2008

Status May 19

All three streams have progressed through March and into April of their respective first years. Evaluation of the primary diagnostics and data usage seems as expected, and these first few months have passed monitoring tests. The data has been approved for transfer to the GES DISC, where the data will be available for download.

We are still testing some of the software for accessing the data files. However, it won't be held for any significant length of time. When we get a schedule for opening the data, it will be posted on this site.

The runs seem to be going smoothly, and with throughput back near the 10 days per day level. (a good sign).

Wednesday, May 14, 2008

Status May 14

All three MERRA streams have been running, and past their respective first month. We have started evaluating the first months, so far no surprises. The evaluation is not yet completed. The vertically integrated budget diagnostics are fully incorporated in this version, and the online file specification document should be updated soon. The budgets are complete and deep into the terms of the equations, owing to the thoroughness of Larry Takacs and Max Suarez. We'll try to post some more information on this soon.

We still are only getting 8 days per day throughput. A planned upgrade to the computing system should improve I/O, and is expected to help regain the throughput.

Friday, May 2, 2008

Status May 2

The fixed tag of the data assimilation system has been handed off to operations. They are preparing to restart the streams. However, we found that the updated PAOBS data had a problem in 1988. A different data format has caused problems there, but not in any other
data files. The 1988 PAOBS are being reprocessed. Since this affects the start of the 1989 stream (stream 2), it will continue to hold for the data fix. Otherwise, we should see Streams 1 and 3 restart today.

Thursday, May 1, 2008

Reanalysis Information and Precipitation work

The previous post on reanalysis precipitation climatology was some extra information from a paper recently accepted at the Journal of Applied Meteorology and Climatology, the pre-press version is available online at AMS. Evaluations of the GEOS5 precipitation are discussed in the last section.

More generally, the extended abstracts from the 3rd International Reanalysis Conference has been published online. See the email copied below.

begin message -----

Dear Participants

We would like to announce that the extended abstracts of oral and poster presentations at the third WCRP International Conference on Reanalysis that took place in Tokyo, Japan, 28 January- February 2008, are now available at following URL.

[World Climate Reanalysis Programme]
http://wcrp.ipsl.jussieu.fr/Workshops/Reanalysis2008/abstract.html

Thank you for your cooperation,

Best regards,

Eriko Moriai


Secretariat for WCRP International Conference on Reanalysis

Thursday, April 24, 2008

Status April 24

The three streams are holding at the end of their spin up periods. Some refinements are being made to the budget output diagnostics for better closure. We have also been reviewing our input data holdings. A gap in the PAOB data set was found from 1997 through the end of 2000. The PAOB data starts back up in 2001 through our CDAS input data stream.

After checking this issue with Jack Woolen at NCEP, we found that he had just finished preparing revised PAOB data set (including about 4x more data) from 1985-2000 using JRA25 and ERA40's data holdings. In short, we are aiming to implement these data (many thanks to Jack, and counterparts at JMA and ECMWF). So, the restarts will be delays a few days to test this implementation.

For further information on PAOB, see http://www.bom.gov.au/bmrc/basic/wksp16/papers/Seaman.pdf

A consistent positive impact from the PAOB data suggests that this is worth a couple days to put into the system.

Friday, April 18, 2008

Status April 18 - Rewind

The data drop reported in the last status posting prompted some deeper digging in the input data streams. One issue led to another, then another. Briefly, a bug fix that should have been zero difference actually caused double counting in some of the input data streams, affecting the 1979 and 1989 streams. Further, a resource file had incorrect settings in the 1998 stream, leading to several observation systems not being assimilated.

The net result is that the data cannot be used as expected, and almost all the production processing needs to be re-run. The estimate for getting production restarted is Wednesday Apr 23. In addition, these errors have exposed some blind spots in our monitoring routines and adjustments are being made, and more personnel time is being devoted to monitoring.

Tuesday, April 15, 2008

Status Apr 15

Over the past weekend, Sondes dropped out for a day (mid-Oct 1979) from the data stream (they exist, but the something in the computing environment skipped a beat). So, on Monday AM 4/14, the 1979 stream was backed up to the previous restart before the data drop, and restarted. The monitoring team is looking for issues like this routinely.

Checkout the revised Production Progress web page. Updated regularly with the current day that is being produced.

http://gmao.gsfc.nasa.gov/research/merra/progress-events.php

Friday, April 11, 2008

Status Apr 11 - Long

There has been much going on, and a lot keeping me from these updates, unfortunately. There are several items I'll include here.

First, our late 90's "scout run" (2 degree resolution, same system as MERRA) was running well ahead of the reanalysis, but encountered a problem in a single file of MSU data. There was a corruption in the input file. it has been found and corrected. That's the benefit of these coars scout runs, they should find the problems that would otherwise slow down the processing.

The system had been running at just over 10 days per calendar day for some time. However, we have been only getting ~7 days per day lately. It's a technical problem that the computer folks are working. It basically comes down to increased usage on the machine, affecting the MERRA jobs. People are looking at it, to try to get the performance back up.

We have a monitoring routine established. Some climate maps are being inspected each month of reanalysis. (Some examples posted below) Soon we hope to make those available on the internet. The monitoring code also includes range checking on each and every variable and layer produced by the system. We have some hits in the range checking from variables SHLAND (land only sensible heat flux) and TSTAR (surface layer temperature scale). TSTAR seems to be spiking sporadically, but in conditions with low wind speed and near the change from night to day (stable to unstable) conditions. It does not appear to be a severe problem, there is no plan to stop or back up MERRA for these flags. SHLAND is showing range check errors at a few, very repeatable points. Those are where the fraction of land is much smaller than that for ocean. So, it appears that ocean is driving a surface atmosphere that is causing convergence problems in the land parameterization where the fraction of land is small. For example dry soil with a dominantly tropical ocean point. So far, the grid average sensible heat seems reasonable, so there is no immediate plans to correct this, or stop and rewind MERRA.

Range checking has also found occasional occurrences of shortwave radiation diagnostics are reporting negative numbers. The magnitude is very very small, and the result of roundoff in the interpolation, and not protecting against such negative values. The net effect of these should be extremely small, but may trip code that expects perfectly zero values of shortwave radiation components. Users will be advised to clear such negative values.

A systematic difference from other reanalyses has been occurring monthly and in each season. Below the zonal specific humidity and 850mb map of specific humidity compared to ERA40 in JJA 1979 is attached. These biases were noted in validation. The contour interval is small and the range close. The MERRA data is dry in the tropics at 85omb and wet above 700mb. This is an interesting result, considering that the total column water and precipitation have been very well reproduced.

There's more to come, including online access to figures that the GMAO is using for monitoring.

Zonal mean specific humidity for JJA 1979 compared to ERA40.
850 mb Specific Humidity for July 1979 compared to ERA40.
Global Precipitation difference of existing long reanalyses compared to GPCP (CMAP differences included for reference) for July 1979.

Tuesday, March 18, 2008

MERRA FAQ

We have started to put together a list of frequently asked questions regarding MERRA. Obviously, it will grow with the frequency of questions. Comments or questions posted here will also contribute to the list.

http://gmao.gsfc.nasa.gov/research/merra/faq.php

Friday, March 14, 2008

Status Mar 14

All three streams have been running, though there was some down time on the supercomputer last night. So far:

  • Stream 1: 19790227
  • Stream 2: 19890121
  • Stream 3: 19980109
When the jobs are running, we get ~10 days per real day from each stream.

Tuesday, March 11, 2008

Status Mar 11

All three MERRA streams are running. Stream 1 has just finished Jan1979, so we'll be evaluating that tomorrow. Streams 2 and three are still in their final spin up period, but will be finished with the spin up by tomorrow.

We have a link to an image that is regularly updated and shows how much data of each stream has been produced, as well as how much data is left to produce.

http://gmao.gsfc.nasa.gov/operations/merra_status_production.gif

Needless to say, at this point we have much more to do.

Friday, March 7, 2008

Status Mar 7

All the updates are checked in and Stream 1 (starting 1979) has restarted. Streams 2 and 3 should also start soon.

Wednesday, March 5, 2008

Status Mar 5, Rewind

Since the last post, we found that the coefficient update being implemented (and a required fix) also affected the MSU data for TIROS-N which is the only satellite data in early 1979. Since this is a non-zero difference, we need to rewind the 1979 MERRA stream (it had progressed to the start of NOAA-6, July 1, 1979) and rerun.

While testing the updated coefficients, some zero-difference updates to the output diagnostics were incorporated to the system. The updated tag is being handed back to operations, who should be able to restart Stream 1 (1979) before the end of this week. In looking at the first 6 months of the 1979 that is being rerun, the output seems much as we expected from validation experiments.

We still have some backlog in the computing queues for other projects, and we are going to rerun our 2006 validation experiment with the updated coefficients as a formal validation of the implementation of this update. It is important to not that the model physics and generally the data assimilation has not changed in some time, and the bug fix to these coefficients are part of the input data stream.

Saturday, February 16, 2008

Status Feb 15

The MERRA Stream 1 (starting Jan 1979) has been progressing steadily, up to mid March 1979. We've had a look at Jan 1979, and it looks to be within expectations. The second two streams are on hold, mainly because there are some short experiments still being run.

However, it has also come to our attention that the CRTM team are fixing a bug in the coefficients for MSU radiances. Stream 1 won't assimilate these until July 1979, but the second stream will assimilate these immediately. The hold for the short runs will continue through next week, at which time the status of the update to these coefficients will be reevaluated. However, all indications are that the reanalysis should not proceed until these are included in the CRTM. This is an interesting development. We'll run some tests of the impact of the bug fix.

So, in the mean time, we can continue the processing of the Stream 1, and evaluate it along the way. Some results will be posted in the next couple days.

Sunday, February 10, 2008

Status Feb 10

One of the last few fixes included in the system (discussed in the previous update), one that should have been minimal impact, greatly affected some code in the data assimilation. The result was that many wind observations that should have been assimilated were not. The problem was apparent (actually the system crashed), so the fix has been fixed.

There have also been several down times in the last week while some updates were made to the computing platform. So far, it looks like the data stream starting in 1979 has been running continuously (or at least regularly) over the weekend. It is up to 15 JAN 1979 after starting on Friday in December 78. So, if all goes well, by Tuesday we should see the first month of MERRA data.

With all the down time, some short reprocessing experiments that the GMAO is producing for instrument team support have been delayed. So, there is a backlog that is being cleared out. Once clear, the second two streams will be restarted from Jan 1989 and Jan 1998, respectively.

Thursday, January 31, 2008

Status Feb 1

The three streams are ready to start. The first has run from Jan 1 1979 to Jan 9. However, all are on hold while system maintenance is being done (in other words, the computers are down).

By Monday, I'll be back from the 3rd International Conference on Reanalyses in Tokyo Japan, with better information. It has been a very interesting meeting, with status updates from the 20th Century reanalysis project and the NCEP CFS Reanalysis and Reforecast project (see the ppt at the CFS Site). Stay tuned to these interesting activities too!

Sunday, January 27, 2008

Status Jan 28

The three spinup runs reported earlier have completed 1 year of spin up. These have provided the starting points for the MERRA production. The output diagnostics have been updated to correct minor diagnostic bugs, and when the system is rebuilt, production will begin.

I'm monitoring status from the 3rd WCRP International Conference on Reanalysis, and will this page when new information is available.

Saturday, January 19, 2008

Status Jan 19

A data flag was out of place, and Stream 1 had to be backed up. All are still moving forward to the end of the December of their respective spin up phases.

Stream 1 date completed: 19781202

Stream 2 date completed: 19881124

Stream 3 date completed: 19971124

The at the end of December of each stream, the system will be rebuilt one last time.
While checking the output data, several minor bugs were found in the output, but nothing that changes the physics. A few other bugs have also been found, which may be non-zero in the physics. These are present being address, but none are considered to be significant changes to the results or validation of the system.

Generally, when the system is running 10 days of reanalysis are produced every day, from each stream. This may not add up with extrapolations from recent posts, because of computer downtime, or backing up the system.

Saturday, January 12, 2008

Status Jan 12

The Spin Up periods are still being processed.

  • Stream 1 RUNNING at 11/01/78
  • Stream 2 RUNNING at 09/26/88
  • Stream 3 RUNNING at 09/27/97
A group of GMAO folks have begun a final check of consistency between the output data files and the file specification document. The group will report back next Thursday.

Friday, January 4, 2008

Status Jan 4

Over the holidays, the last few science fixes went into the system, and the spinup periods resumed. Each of the three MERRA processing streams is presently running, with the data to be discarded for spinup.

  • Stream 1 RUNNING at 08/31/78
  • Stream 2 RUNNING at 07/30/88
  • Stream 3 RUNNING at 07/30/97
As a reminder, the planned start day for each stream is Jan 1, 1979, 1989 and 1998 respectively. They are moving at approximately 10 days per day, when the computer systems are up. They will hold at the end of each November, so that the last patch of the system (engineering fixes to the output diags, scripting and post processing that do not affect science) can be put into place. At that time, the GMAO will also make an evaluation of the output diagnostics, to ensure that the data and units all match the file spec document.

There is a known issue already becoming apparent. The CRTM coefficients for NOAA 8 AMSUA channel 14 have some problems. This data doesn't begin until May 1983, so there is time to correct the problem without affecting the MERRA production schedule. Further updates as the run get closer will be provided.

Happy New Year!

Wednesday, December 5, 2007

Reanalysis Precipitation Climatology

On the MERRA WWW page, we are posting several figures showing the comparison of 5 satellite era reanalyses with GPCP and CMAP precipitation data sets. There are some similarities among the reanalyses, in their differences from the observations (Tropical precipitation, and interestingly European continental January precipitation), but also differences between the merged observation data sets (GPCP has lower tropical precipitation than CMAP, but higher January precipitation, in general). Citations are provided on the page, that provide some analysis and discussion on the sources of bias. However, there are many other aspects in comparing reanalyses to the observed data. These are only climatologies, so that interanual variability, weather scale and diurnal cycle differences are not expanded.

The WWW page is at: http://gmao.gsfc.nasa.gov/research/merra/reanalysis_precipitation_climatology.php

Please take a look, and feel free to make comments on this blog.

Thursday, November 29, 2007

Status Nov 29

Just a brief post. The spinup runs are still on hold. The physics in the system seems to be set and the output diagnostics are likewise set. The main hold up is that the adaptive bias correction of a small number of channels over land is not stabilizing even after long (coarse resolution) runs, and continues to grow ultimately leading to the rejection of observations that should otherwise be accepted. A patch seems to be working, and a clean experiment is getting underway today. The spinup experiments should be restarted soon, and that will be posted here when it happens.

Tuesday, November 20, 2007

Summary of the MERRA User's Review Group Meeting

In late 2005 a MERRA review group was formed from experts in various aspects of Earth system science and users of existing reanalyses. Their charge was to review the GMAO strategy for MERRA and the validation experimentation and results, possibly contributing some of their own analysis. The goal for GMAO was to gain a preliminary assessment of the scientific merit of the GEOS-5 data assimilation system for MERRA prior to full production. In September 2007, the validation experiments began, and on November 7, the user review group met to discuss the results of the validation experiments with the GMAO and NASA HQ representatives.


The GMAO started the day, presenting a summary of the system and critical improvements in recent months (Rienecker), the dynamical circulation, clouds and radiation (Suarez and Bacmeister), climate variability features (monsoons, hurricanes, low level jets (LLJ) and diurnal cycle - Schubert) and precipitation statistics and land hydrology (Bosilovich and Koster). Key points from the presentations are summarized below.

Michele Rienecker reviewed some major and critical changes to the system since the inception of the Review Group. These include improvements in the use of retrieved wind speed over the ocean, improvement in the radiance assimilation (through the latest CRTM radiative transfer coefficients), corrections to bias and jumps in the radiosonde observations and a fix for diurnal cycle of glacier surface temperatures.

In looking at zonal circulation, Max Suarez showed the differences between the GEOS-5 and other reanalysis systems for winds, temperature and humidity. For example, the GEOS-5 eddy heights compare with ECMWF operational analysis both in a mean sense, and in the interannual variability. With small contour intervals in the zonal cross-sections, differences in tropopause height can be identified among all the reanalyses. In addition, GEOS-5 reproduction of stratospheric ozone profiles is reasonable, and a limited comparison of the beginning of a quasi-biennial oscillation looks promising. One possible systematic problem is high upper troposphere humidity (as compared to ECMWF and NCEP operational analyses). The radiation fluxes have some bias, as well, but these are somewhat reduced compared to the existing reanalyses (Figure 1).

Siegfried Schubert reviewed some evaluations of monsoonal circulations, including the North American monsoon and Indian monsoon. GEOS-5 reproduces the low level winds (e.g. the Somali jet and the Great Plains LLJ) as well as the subseasonal breaks observed in the monsoonal precipitation. There are some apparent regional biases in the precipitation, but this is also true among all the existing reanalyses. The GEOS-5 North American monsoon circulation and precipitation compare well with the North American Regional Reanalysis (NARR) (for July 2004, Figure 2). Globally, the interannual variations of precipitation compares well with observations, and better than existing reanalyses. In addition, the monthly average water budget shows globally averaged analysis tendencies to be a small value (Figure 3). However, the diurnal amplitude of continental precipitation is large and the phase is shifted to a daytime maximum compared to observations. This is a problem for all reanalyses, and it persists in the GEOS-5 system.

Mike Bosilovich reviewed monthly mean precipitation, where GEOS-5 generally produces good fields compared with GPCP and CMAP, not only in the global mean, but also spatial correlation. In addition global P-E is generally small (near zero) indicating that the global analysis is relatively well balanced (but will be non zero). The GEOS-5 precipitation is reasonable in many regions and latitude bands. Comparisons for the Mississippi River basin precipitation against daily gauge data show the GEOS-5 was able to produce the daily precipitation events, and the no-rain days for Jan-Oct 2004 (Figure 4). However, maximum intensities in the warm season are underestimated, leading to an underestimate of the total basin precipitation. Randy Koster’s analysis of the time series of precipitation shows that the occurrence of rain during the day coincident with solar forcing causes high interception loss of water vapor, and then the runoff water is underestimated. The transition of the observing system to include SSM/I was tested in a data withholding experiment. GEOS-5 tropical precipitation increases with the inclusion of SSM/I, but the increase is less than 10% of the tropical precipitation (in contrast, JRA25 has a change in extratropical precipitation). There is also a small increase of total column water, ocean surface winds and ocean evaporation.

The overall conclusion is that the GEOS-5 system can produce many aspects of the Earth system as well or better than existing reanalyses. The quality of the data coupled with the fine temporal and spatial scale of the data should make the GEOS-5 reanalysis useful for many purposes. While there were spirited discussions among all the participants, the external user group members’ sentiment reflects this conclusion as well. As of November 2007, the reanalysis data streams are being spun up, and data should start flowing to the scientific community early in 2008. The full MERRA data product will take approximately 18 months to generate.


Figure 1 Monthly mean (Jan 2004) TOA Longwave radiation differences between CERES ERBE-like observations and several reanalyses and operational analyses.

Figure 2 Comparison of the seasonal evolution of the North American monsoon between the North American Regional Reanalysis (NARR) and GEOS5.

Figure 3 Global vertically integrated water vapor budget for July 2004 including the physical components, the analysis increment and residual.

Figure 4 Mississippi River basin area-average (over all sub-basins) daily precipitation for January – September 2004. The figures show the scatter of the daily data, the daily time series, and the accumulated precipitation. The observations are CPC daily ¼ degree gridded gauge data.

Friday, November 9, 2007

Status Nov 9

The validation of the system has been somewhat time consuming between this post and the previous, and much has happened. At least 20 GMAO staff (or more) spent several weeks interogating the validation experiments each focusing on various Earth system components. On Oct 11, the GMAO held an internal review of the validation experiments. On Nov 7, the summary of these results were presented to our User Review group in a meeting at GSFC. My interpretation of the Review is that the system has more than enough scientific merit to proceed to production phase, weighing the advances and advantages against the limitations and some weaknesses. When any formal writing from the Review are made available for public posting, I'll put it on the blog. This is a significant milestone for the MERRA project and the GMAO.

There were many very positive results that came out of the MERRA validation experiments. Too many to easily synthesize into blog posts. A validation document is under development, but should take some time. Some results will be posted here as time goes on. In the near term, however, validation pointed out a serious flaw in the system. When the CERES science team evaluated the data, they found that Antarctica and glaciers did not have a diurnal cycle of surface temperature. The reason ended up being a thick glacier layer. Some new code, including a thinner layer and revisions to the energy budget code have produced very reasonable results. So, this fix will be added to the MERRA system. (see the Figure)

Figure: Time series of 2m air temperature at two Antarctica stations. The green line indicates GEOS5 Patch 15, Blue is patch 20 (including the fix) and the read is ECMWF operational analysis. Model data are the nearest gridpoint to the stations. Station data is marked with a black box.

So, the spin up of MERRA production runs are on hold until the system is updated. Some testing of convection parameterization coefficients has been going on through this process. A decision is pending on which, if any, will go into MERRA. The issue to be resolved are, updating the system with new glacier surface temperatures, finalizing the MERRA output routines and final evaluation of the convection parameterization. Spinup runs will restart once these issues are resolved.

Thursday, September 27, 2007

Status Sept 27

Just a quick post on current jobs and activities.

The validation runs for Jan-Jul and Jul-Oct 2004, Jan and Jul 2006, Jul and Aug 1987 are complete. Jan and Jul 2001 are going, and should wrap up next week. For the next two weeks a summary of the results will be pulled together.

For production, the system will run in three data streams. Each stream will be spun up for two years at a coarse (2 degrees resolution) then the native MERRA resolution for 1 year. The streams will each start at January of 1979, 1989 and 1998.


Presently, the coarse (2 degree) runs are complete and the native (1/2 degree) spin up runs have started. They are all either completed January or into February. Each stream is producing around 10 days/day when the computers are up. With reasonable up time, they should reach the nominal beginning of production by early November.

Friday, September 7, 2007

Incremental Analysis Update

GEOS5 uses an Incremental Analysis Update (IAU) to constrain the atmospheric numerical model by observations. The following figure shows the schematic of the procedure. Starting at 09Z, a 6 hour forecast is run, and forecast data from 09Z, 12Z and 15Z are used to create the analysis (blue diamond). From the analysis and the forecast, a tendency is calculated. This tendency is applied to another model forecast cycle in the prognostic equations (green arrow and light blue box). This is called the corrector segment, so that the tendencies are nudging the model forecast in the direction of the observations at every time step.

MERRA will have two primary products. First, the analyses will consist of the model state variables written instantaneously after the analysis every 6 hours (00Z, 06Z, 12Z and 18Z). There will be model level (72 eta levels) and pressure interpolated (42 pressure levels) for each analysis time. Second, the diagnostic fields are written from the model corrector segment. These include 1 hourly average 2 dimensional (1/2 deg latitude by 2/3 degree longitude) surface, single level (e.g. H500), radiation, land specific and vertically integrated fields. In addition, 3 hourly average 3 dimensional coarse resolution 1.25 deg x 1.25 degree) atmospheric diagnostics are produced from the corrector segment. These include all the tendencies for the state variables, as well as fluxes and budget terms.


One advantage of IAU is that it allows the corrector segment data to be written. This data is exposed to the observational forcing spread out in time, rather than a large change in the initial conditions. The spin up spin down problems in the forecast, associated with initializing a forecast system with an analysis data, are much smaller. Essentially, this allows the production of 1 hourly precipitation and other physics fields. The figure below shows a global average precipitation time series (data is written at every model time step, ~30 min) using the synoptic analysis as initial conditions, IAU and a pure model forecast. Reinitializing the forecasts with the analysis causes jumps in the time series. The free running model tries to have a global precipitation rate of ~3 mm/day. The analysis tried to reduce that, but after the initial time the forecast starts to drift back to it's preferred climate state. The IAU provides forcing at every time step, constraining the system with the observations.

Monday, September 3, 2007

Ocean Surface Winds and Fluxes

The ocean atmosphere interactions are one of the crucial elements in climate variability. The MERRA system does not have a coupled ocean model and data assimilation, but future reanalyses will likely go in this direction. In MERRA, seas surface temperatures are prescribed and ocean surface wind observations (from buoys and satellites) are analyzed. Downward components of the radiation would be related to the parameterized clouds and radiation calculations, as well as the input observations (radiances, temperature and moisture). The following figures prepared for validation compare some winds and fluxes with GEOS5 experiments and other reanalyses.

This following figure shows the daily time-series for Jan 2004 and 2006 U10M and V10M winds at the TAO mooring location of 165E on the equator. GEOS-5 shows good agreement with TAO and matches the minimum and maximum values everywhere. In Jan 2004 and 2006, GEOS-5 is more highly correlated with QSCAT than NCEP CDAS or JRA-25. The NCEP-CDAS analysis shows several periods of larger bias against the observations.

The next figure shows maps of monthly latent heat flux for GEOS5, JRA-25 and NCEP CDAS. GEOS-5 has much less evaporation out of the ocean than JRA-25 and NCEP CDAS, especially in the western boundary currents: Gulf Stream and Kuroshio. Mean and RMS differences between GEOS-5 and JRA-25 and GEOS-5 and NCEP CDAS are much larger than that of NCEP CDAS and JRA-25 in the above region. Similar patterns are seen in January 2004.

In three validation periods investigated so far (Jan/Jul2004 and Jan 2006), GEOS-5 net radiation is more highly correlated with TAO in the Eastern Pacific that other reanalyses.
NCEP-CDAS generally is biased low in most time-periods and TAO locations. GEOS5 also correlates well with the TAO incoming shortwave radiation observations.


The three reanalyses are fairly different in their net heat fluxes. GEOS-5 has less heat loss than both NCEP and JRA in the Kuroshio and Gulfstream areas, and more heat gain off Western Australia. In the 45S-45N band, GEOS5 and JRA have substantial differences.

Tuesday, August 28, 2007

Update and TOA Radiation

Vacations in August have limited the posting, but the validation experiments are continuing. The experiments are moving well, and the system performance will be discussed in another post. Here are some of the validation comparisons for TOA radiation of some reanalyses to CERES ERBE-like data from Terra and Aqua. In the figures, the GEOS5 validation experiment is labeled d5_b10p15 (d is the 1/2 degree resolution, beta10 patch15 is the version of the data assimilation system).

The first figure is the zonal mean of the TOA LW and SW fluxes in Jan and Jul 2004. CERES observations are in red, GEOS5 is blue, JRA-25 is black and NCEP RII is green. GEOS5 shows somewhat smaller bias in the tropics LW, and also mid latitude SW. The July upward SW in the tropics seems biased high compared to the obs and other reanalyses, but otherwise, it seems in the range of the reanalyses. (Click on thumbnails to see the full figure)


The next two figures show the monthly mean maps of the comparisons. to CERES Terra. The differences between the CERES-Terra and CERES-Aqua are provided as a reference. In TOA LW, JRA-25 seems systematically biased high, while NCEP RII has strong positive and negative variations. GEOS5 leans to a high bias, but not as high as JRA. JRA and NCEP also show large positive bias in the tropics, which impling a dry upper troposphere or low cloud top. Newman et al (2000) have evaluated the interal consistency of several reanalyses, between OLR, precipitation and upper level divergence. In addition, they note that the correspondence among the reanalyses is quite low. The reanalyses OLR are all different from each other.


The shortwave biases of the reanalyses generally are similar. The exception seems to be the polar warm season. For example, TOA SW in Antarctica January is high for NCEP RII and GEOS5, but low for JRA.


Newman M., P. D. Sardeshmukh, J. W. Bergman, 2000: An Assessment of the NCEP, NASA, and ECMWF Reanalyses over the Tropical West Pacific Warm Pool. Bull. Amer. Meteror. Soc. 81, 41–48.

Smith, G. L.; Wielicki, B. A.; Barkstrom, B. R.; Lee, R. B.; Priestley, K. J.; Charlock, T. P.; Minnis, P.; Kratz, D. P.; Loeb, N.; 2004: Clouds and Earth Radiant Energy System (CERES): An overview, Advances In Space Research, 33, 1125-1131.

Wielicki, B.A., B.R. Barkstrom, E.F. Harrison, R.B. Lee, G. Louis Smith, and J.E. Cooper, 1996: Clouds and the Earth's Radiant Energy System (CERES): An Earth Observing System Experiment. Bull. Amer. Meteor. Soc., 77, 853–868.

Friday, August 10, 2007

Historical Satellite Assimilation

When evaluating one of our first analyses in the 1980s, we found some results very different from what was apparent in the recent (2001-2006) experiments. The experiment was run to test the impact of SSMI on the reanalysis time series (See this report). THe increments were drying the lower tropospehre continuously, and precipitation was small and getting smaller. Several aspect of the system were studied to pin down the problem. One hypothesis was that older coefficients (for the radiative transfer model) for the historical satellite data were causing some of the problems. NOAA NESDIS was in the process of creating new coefficients, and were able to make the new values available for testing, and now for the whole reanalysis period.

The figure below shows the time series of analysis increments of temperature and moisture for the old coefficients compared to the new coefficients. The original coefficients lead to large drying increments in the lower troposphere, as well as dramatic jumps at the when the satellites change. NOAA10 data starts at the end of Oct 86, and a couple channels drop out for several days in January 1987. The new coefficients work much better with the radiance assimilation, and the increments are much more uniform.


Thursday, August 9, 2007

New JRA-25 Citation

Subject: JRA-25 paper
Date: Thu, 09 Aug 2007 13:02:25 +0900
From: JRA-25 user administrator

Dear JRA-25 reanalysis data users,

Sorry the address written in the previous mail was wrong.
Please refer the next address.

JRA-25 standard reference paper titled 'The JRA-25 Reanalysis' is aviailable from
http://www.jstage.jst.go.jp/article/jmsj/85/3/369/_pdf/-char/ja/

Please forward this mail to researchers who are interested in reanalysis.

Sincerely yours,

Secretariat of JRA-25
CPD/Japan Meteorological Agency

Saturday, August 4, 2007

2004 Precipitation

Precipitation from a couple cases has been posted previously. Below are the monthly mean differences from GPCP for the GEOS 5 2004 January and July validation experiment, compared with JRA25 and NCEP. Qualitatively, the patterns of difference maps seem quite similar among the reanalyses. Though, the GEOS5 US precipitation seems low where the others are high. The GEOS5 tropics are also lower than the other reanalyses, a positive result. It is interesting to note that all the reanalyses underestimate GPCP in Europe in January. GPCP applies a snow undercatch correction, especially in Europe, which increases the precipitation. The GEOS5 southern hemisphere and North Atlantic biases appear quite low compared to the other reanalyses.

To expand on the comparisons, we are also producing Taylor Diagrams (Taylor 2001) for precipitation. The preliminary figures follow the mean difference maps. These show the spatial correlation of the reanalysis compared to the normalized standard deviation. The reference data set is GPCP, so the reanalyses are correlated to GPCP, and the standard deviation is normalized to GPCP. The closer the point is to 1:1, the closer a match to the reference data set. Here, CMAP is also included to show a portion of the uncertainty in the observations. By this metric, GEOS5 is improving the spatial pattern on the monthly precipitation. Spatial resolution of the analysis likely plays a role.

A more detailed examination of these statistics is underway, including more localized regions (such as the NA and SA continent). These relate to the monthly precipitation. The higher frequency precipitation is also being examined, compared to TRMM 3b42 3 hourly 1/4 degree. There is some uncertainty with those observations (satellite swaths are occasionally apparent in the spatial structure), but the comparisons so far have been promising where weather systems are reasonably reproduced.


Monthly mean precipitation differences from GPCP for NCEP R1, R2 , GEOS5 and JRA25. January 2004 (above) July 2004 (below).
Monthly Taylor diagrams for precipitation for the globe, NH, SH and Tropics using GPCP as a reference data set for NCEP R2 , GEOS5, JRA25 and CMAP. January 2004 (above) July 2004 (below). The normalized standard deviations increase with radial distance from the origin. All standard deviations are normalized to GPCP so that a value of 1.0 matches GPCP. Spatial correlation are plotted as the radial lines, so that the 1,1 point is identical to GPCP.

Tuesday, July 31, 2007

Status July 31

Several validation runs have started, and results are only just becoming available.

For 2004, two experiments have begun, one starting in January 2004, and the other starting in July 2004. These will run forward through 6 months to provide a full year of analysis. So far, the first months (January and July) have recently completed, and results for those months should be available soon.

January 2006 was run, completed, and evaluations begun. However, between the time it was started, and its evaluation, it was determined that the initialization of the satellite bias corrections was a problem. A new experiment has begun and should be ready for evaluation soon. This will also serve as a test on our bias initialization procedures, which need to be done each time a new satellite becomes available.

The problems with initialization of the satellite bias corrections became apparent in evaluating the SSMI experiment, discussed in the July 10 status update. The NOAA 10 data began using a bias correction that was determined from a previous experiment, with different physics, and hence, different biases. Large parts of the SSMI experiment are being re-run, including some half degree experiments and data withholding experiments. In addition, new coefficients for the historical NOAA radiances are available. Presently, these are being tested. It is worthwhile to mention that the science in the system has been frozen, and these tests are more related to the input data for the 1980s.

File Spec: Thanks to those who have taken time to look at the document! Reviews and intercomparisons of the doc with the output data have identified some inconsistencies. The developers are well into resolving the discrepancies. A new file spec document should be posted soon.

The initial conditions and input data for spin up runs for the MERRA production streams are being developed. When operations personnel get some time, these will be started so as to not lose time while we validate. This expects a favorable result from the validation of the system. The spin-up and steams for MERRA production will be posted separately.

AMS abstracts are due August 10, and the WCRP reanalysis conference abstracts are due today. There will be several GMAO presentations at each of these on MERRA validation.

Thursday, July 19, 2007

Pressure levels intersecting the surface

Many modern atmospheric numerical models use terrain following vertical coordinates, meaning that the pressure of the lowest model level tracks the topography and does not intersect the surface. ERA40 and NCEP reanalyses have produced pressure level data extrapolated downward beneath the Earth’s surface. The result is that for 850, 925 and 1000 mb levels etc, continuous grids are available. Previous versions of GEOS models and assimilation systems have not extrapolated data beneath the surface, favoring to provide undefined values when the surface pressure is lower than a given pressure level.

For instantaneous analyses, comparing GEOS5 pressure levels to other reanalyses would be straight forward, once the undefined value is considered. However, monthly averages pose a problem. There are some regions and pressure levels where the number of valid values may be available for a fraction of the times. If all valid values of GEOS5 are averaged and reported, the average would not be representative or comparable to NCEP or ERA40 reanalyses which made averages of all times.

Figure 1 850 mb temperature RMS error between GOES5 and NCEP analyses for different criteria of the sampling of missing data in the GEOS5 time series. At the left of the graphs, lower criteria allow undersampling of the monthly time series to be compared with NCEP complete monthly mean. Far right, rejects points that have missing data in the time series, so there are fewer data points, but the comparisons to NCEP are more completely sampled. (Click figure to enlarge)

This can lead to an increase in the squared error and systematic bias between GEOS5 and other reanalyses because of the temporal sampling at the edges of topography. This is also noticeable in global and regional map comparisons. We computed global monthly averages testing a range of criteria for rejecting a monthly average. The criteria are applied at each grid point and are based on the percentage of valid data over the month. In Figure 1, on the far left, if data are valid only 1% of the time during a month, a valid monthly mean value is saved. Moving right, at 20%, a grid point with valid data 20% of the month produce a monthly mean (fewer than 20% are reported as undefined). At the farthest right, the strictest criteria requires that for each gridbox to produce a monthly average much have gridpoints that have valid data 100% of the time. The two figures are global land only and North America (20-70, -170--60). At higher pressure, there are more points affected by sub-sampling, and the errors are most noticeable in these large area averages. For higher altitudes, the large scale error drops slowly for criteria greater than 20% (more points valid 100% of the time).
Figure 2 Comparison between GEOS5 and NCEP for different criteria, and a map of the sampling percentage. At 20% criteria (data is valid only 20% of the month) large differences are apparent. These are reduced at 80%. At 100% the data should be showing only differences between full monthly averages, no effect of sampling. There are some artifacts because these figures have interpolated NCEP to the GEOS5 ½ degree resolution. Differences near topography can be significant and misleading (to one not knowing about the character of the data). (Click figure to enlarge)

To address this issue in the monthly mean MERRA products, only means which include counts that exceed a threshold of 20% valid data are included in the mean. Otherwise, the monthly mean value is reported as undefined. This low value is defined to provide as much information as possible. The monthly mean 3D pressure files will also include a variable that counts the valid data at each pressure level. The data user can then screen data to suit their needs. This can also be used to screen other data sets for comparison purposes, and also zonal averaging.

One difficulty that may arise is the lack of a 1000-500 mb thickness diagnostic. This was produced in some previous versions of GEOS5. However, in revising the pressure level interpolation code for MERRA, the calculation of 1000 mb height has been left out, and so, 1000-500 mb height is not available. Also, consider that the 1000 mb analyses will have undefined data over large areas of the globe (land and ocean). Lowest model level data are also available that may be suitable for some purposes, instead of the 1000mb level.

Tuesday, July 10, 2007

Status July 10

The January 2006 validation experiment is underway. This period has been rerun enough in recent weeks that much of the preparatory work had already been done. The primary validation experiment for 2004, is still being prepared. Scripts, code and data need to be in place and working together, soon was the latest update.

There has been much work on the mid- to late- 80s experiment (referred to as the SSMI experiment). Originally, this was established to investigate the impact of the availability of SSMI observations in July 1987 on the time series. The experiment was initialized in Mid-Dec 1983, and run almost through 1990. The spatial resolution is coarse (2 x 2.5), and the version of the system is slightly behind the expected version for MERRA validation (a subsequent test shows that the physics/statistics difference do not change the main results of the SSMI experiment).

The main points to be discussed on the SSMI experiment are:

1. Global time mean precipitation bias
2. Water cycle time series
3. Impact of SSMI

1.) As stated on the previous post, global time mean precipitation, where the SSMI experiment (version b10p9 read - beta 10 patch 9) is 2.2 mm/day compared to 2.6 mm/day for GPCP and ~3mm/day for JRA25 and ERA40. An experiment at the full resolution and fallback MERRA version of GEOS5 (b10p14) shows that the precipitation to be ~0.2mm/day higher than the coarse resolution experiment. Most of this increase is a result of the spatial resolution. Much of the difference in the precipitation is over the tropical oceans where reanalyses are typically much to high. As the system stands now, global mean precipitation is lower than GPCP in the mid to late 80s.

2.) The time series of the SSMI experiment also showed some features that are currently being investigated more closely. Figure 1 shows the time series of precipitation anomalies (mean annual cycle from 1984-1987 removed) for the GEOS5 SSMI experiment, JRA25, ERA40 and GPCP.
Figure 1 (click on the figure to expand it)

Both GEOS5 and ERA40 show a decreasing tendency in the precipitation from 1984 throught the end of 1985. In Jan 1986, ERA40 tendencies reverse and start increasing. In Nov 1986, GEOS5 drops sharply, but stabilizes. NOAA10 data begins in Nov 1986, SSMI begins in Jul1987, NOAA11 begins in Jan 1989. The two issues being investigated are the sudden downward jump of precipitation with NOAA10, and the slight downward tendency early in the experiment. Also the introduction of SSMI is noticeable in the ocean only average (and increase for GEOS5, and a decrease for JRA25).

Figure 2

Figure 2 shows the time series of GEOS5 monthly analysis increments of water vapor (the incremental analysis updates that drive the diagnostic ouput, such as precipitation) at 4 levels in the lower troposphere for latitudes 60S-60N. At the lowest model level (not shown) the shipborne observations of moisture lead to positive increments almost every where and when. Above the surface layer, the lower tropospheric analysis is largely negative increments, acting to dry the atmosphere. The negative increments appear correlated to the precipitation anomalies, though there is also a period between Jul1985 and Jan1988 where TPW increases (see Figure 3). A large jump in the increments and precipitation (Figure 1) is associated with the introduction of NOAA10 (and shutdown of NOAA6 MSU). These are the focus of some ongoing evaluations.

First, an experiment with the latest MERRA system has been run over the start of NOAA10, and it shows less sensitivity in the increments than Figure 2. However, the precipitation in these experiments is similar. To test strictly the sensitivity of the system to NOAA10, a new experiment is being run forward but constraining the NOAA10 observations to passive mode (an analysis is made, but the increments will not contribute back to the system). Secondly, NOAA NESDIS is generating new coefficients for the historical periods polar orbiting satellites (to which we are grateful). It is not clear at this point what the impact of that will be, but will be thoroughly tested prior to MERRA production. Lastly, bias corrections are being made in the system (e.g. for view angle). The procedures for initializing and carrying these bias corrections are being reviewed. This is one possible source of error, but it is not yet clear a problem exists.

In summary for point 2, it seems we have some sensitivity to the observing system (regarding precipitation) on the same order of magnitude as previous reanalyses in the 80s. We are using this opportunity to flesh out an problems in the system that may be exacerbating the discontinuity of the analysis during observing system changes. These tests are intended as checks on the system before production, though, we expect that there will be noticiable changes in the MERRA time series as a function of the observing system.

Figure 3 Monthly anomalies from the Jan84-Dec87 mean annual cycle.

3.) The impact of SSMI was not immediately apparent in GEOS5 global precipitation (Figure 1), and ocean only average precipitation increases. The SSMI impact on evaporation and surface wind speed over the ocean is also apparent (Figure 3), likely related to the SSMI wind speed. The GEOS5 anomalies and JRA25 seem to be tracking really closely. In the mean, JRA is ~0.2m/s higher wind speed than GEOS5 (of 4.4m/s). So, it seems that in some ways GEOS5 is sensitive to SSMI, like JRA. However, in ocean precipitation, GEOS5 is more sensitive to the NOAA transitions than JRA (Figure 1).

Just a caveat regarding these results. In comparisons of the 2 degree resolution with 1/2 degree, the monthly precipitation increases at finer resolution, especially in mid-latitudes. We have not yet run multiple years of the 1/2 degree system, and don't have a grasp on the interannual variations. It should be interesting to see how similar the coarse and fine resolution analyses are over long periods.


Figure 4 Zonal time series of precipitation anomalies (after ENSO removal) for JRA and the GEOS5 SSMI experiment. The impact of SSMI on JRA is apparent in the southern hemisphere (30-60S). GEOS5 low frequency decreasing precipitation is focused in the tropics.