Thursday, April 24, 2008

Status April 24

The three streams are holding at the end of their spin up periods. Some refinements are being made to the budget output diagnostics for better closure. We have also been reviewing our input data holdings. A gap in the PAOB data set was found from 1997 through the end of 2000. The PAOB data starts back up in 2001 through our CDAS input data stream.

After checking this issue with Jack Woolen at NCEP, we found that he had just finished preparing revised PAOB data set (including about 4x more data) from 1985-2000 using JRA25 and ERA40's data holdings. In short, we are aiming to implement these data (many thanks to Jack, and counterparts at JMA and ECMWF). So, the restarts will be delays a few days to test this implementation.

For further information on PAOB, see http://www.bom.gov.au/bmrc/basic/wksp16/papers/Seaman.pdf

A consistent positive impact from the PAOB data suggests that this is worth a couple days to put into the system.

Friday, April 18, 2008

Status April 18 - Rewind

The data drop reported in the last status posting prompted some deeper digging in the input data streams. One issue led to another, then another. Briefly, a bug fix that should have been zero difference actually caused double counting in some of the input data streams, affecting the 1979 and 1989 streams. Further, a resource file had incorrect settings in the 1998 stream, leading to several observation systems not being assimilated.

The net result is that the data cannot be used as expected, and almost all the production processing needs to be re-run. The estimate for getting production restarted is Wednesday Apr 23. In addition, these errors have exposed some blind spots in our monitoring routines and adjustments are being made, and more personnel time is being devoted to monitoring.

Tuesday, April 15, 2008

Status Apr 15

Over the past weekend, Sondes dropped out for a day (mid-Oct 1979) from the data stream (they exist, but the something in the computing environment skipped a beat). So, on Monday AM 4/14, the 1979 stream was backed up to the previous restart before the data drop, and restarted. The monitoring team is looking for issues like this routinely.

Checkout the revised Production Progress web page. Updated regularly with the current day that is being produced.

http://gmao.gsfc.nasa.gov/research/merra/progress-events.php

Friday, April 11, 2008

Status Apr 11 - Long

There has been much going on, and a lot keeping me from these updates, unfortunately. There are several items I'll include here.

First, our late 90's "scout run" (2 degree resolution, same system as MERRA) was running well ahead of the reanalysis, but encountered a problem in a single file of MSU data. There was a corruption in the input file. it has been found and corrected. That's the benefit of these coars scout runs, they should find the problems that would otherwise slow down the processing.

The system had been running at just over 10 days per calendar day for some time. However, we have been only getting ~7 days per day lately. It's a technical problem that the computer folks are working. It basically comes down to increased usage on the machine, affecting the MERRA jobs. People are looking at it, to try to get the performance back up.

We have a monitoring routine established. Some climate maps are being inspected each month of reanalysis. (Some examples posted below) Soon we hope to make those available on the internet. The monitoring code also includes range checking on each and every variable and layer produced by the system. We have some hits in the range checking from variables SHLAND (land only sensible heat flux) and TSTAR (surface layer temperature scale). TSTAR seems to be spiking sporadically, but in conditions with low wind speed and near the change from night to day (stable to unstable) conditions. It does not appear to be a severe problem, there is no plan to stop or back up MERRA for these flags. SHLAND is showing range check errors at a few, very repeatable points. Those are where the fraction of land is much smaller than that for ocean. So, it appears that ocean is driving a surface atmosphere that is causing convergence problems in the land parameterization where the fraction of land is small. For example dry soil with a dominantly tropical ocean point. So far, the grid average sensible heat seems reasonable, so there is no immediate plans to correct this, or stop and rewind MERRA.

Range checking has also found occasional occurrences of shortwave radiation diagnostics are reporting negative numbers. The magnitude is very very small, and the result of roundoff in the interpolation, and not protecting against such negative values. The net effect of these should be extremely small, but may trip code that expects perfectly zero values of shortwave radiation components. Users will be advised to clear such negative values.

A systematic difference from other reanalyses has been occurring monthly and in each season. Below the zonal specific humidity and 850mb map of specific humidity compared to ERA40 in JJA 1979 is attached. These biases were noted in validation. The contour interval is small and the range close. The MERRA data is dry in the tropics at 85omb and wet above 700mb. This is an interesting result, considering that the total column water and precipitation have been very well reproduced.

There's more to come, including online access to figures that the GMAO is using for monitoring.

Zonal mean specific humidity for JJA 1979 compared to ERA40.
850 mb Specific Humidity for July 1979 compared to ERA40.
Global Precipitation difference of existing long reanalyses compared to GPCP (CMAP differences included for reference) for July 1979.

Tuesday, March 18, 2008

MERRA FAQ

We have started to put together a list of frequently asked questions regarding MERRA. Obviously, it will grow with the frequency of questions. Comments or questions posted here will also contribute to the list.

http://gmao.gsfc.nasa.gov/research/merra/faq.php

Friday, March 14, 2008

Status Mar 14

All three streams have been running, though there was some down time on the supercomputer last night. So far:

  • Stream 1: 19790227
  • Stream 2: 19890121
  • Stream 3: 19980109
When the jobs are running, we get ~10 days per real day from each stream.

Tuesday, March 11, 2008

Status Mar 11

All three MERRA streams are running. Stream 1 has just finished Jan1979, so we'll be evaluating that tomorrow. Streams 2 and three are still in their final spin up period, but will be finished with the spin up by tomorrow.

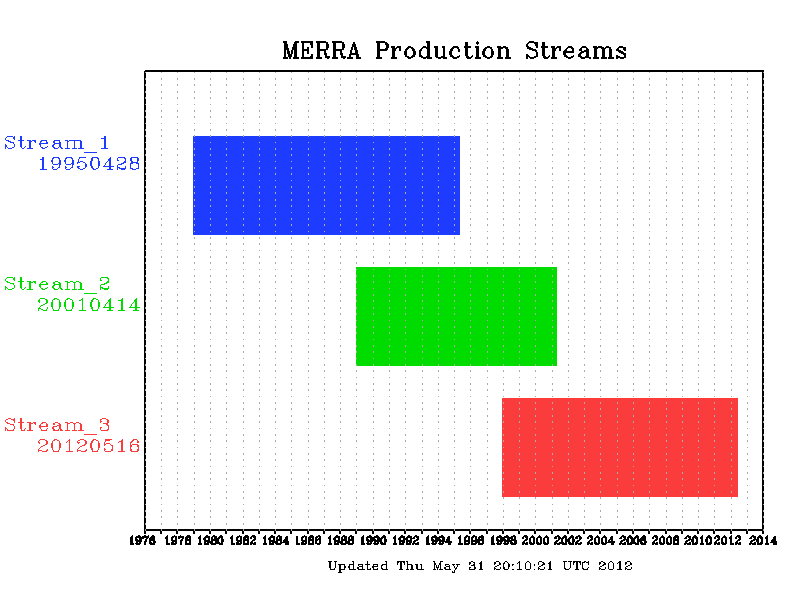
We have a link to an image that is regularly updated and shows how much data of each stream has been produced, as well as how much data is left to produce.

http://gmao.gsfc.nasa.gov/operations/merra_status_production.gif

Needless to say, at this point we have much more to do.

Friday, March 7, 2008

Status Mar 7

All the updates are checked in and Stream 1 (starting 1979) has restarted. Streams 2 and 3 should also start soon.

Wednesday, March 5, 2008

Status Mar 5, Rewind

Since the last post, we found that the coefficient update being implemented (and a required fix) also affected the MSU data for TIROS-N which is the only satellite data in early 1979. Since this is a non-zero difference, we need to rewind the 1979 MERRA stream (it had progressed to the start of NOAA-6, July 1, 1979) and rerun.

While testing the updated coefficients, some zero-difference updates to the output diagnostics were incorporated to the system. The updated tag is being handed back to operations, who should be able to restart Stream 1 (1979) before the end of this week. In looking at the first 6 months of the 1979 that is being rerun, the output seems much as we expected from validation experiments.

We still have some backlog in the computing queues for other projects, and we are going to rerun our 2006 validation experiment with the updated coefficients as a formal validation of the implementation of this update. It is important to not that the model physics and generally the data assimilation has not changed in some time, and the bug fix to these coefficients are part of the input data stream.

Saturday, February 16, 2008

Status Feb 15

The MERRA Stream 1 (starting Jan 1979) has been progressing steadily, up to mid March 1979. We've had a look at Jan 1979, and it looks to be within expectations. The second two streams are on hold, mainly because there are some short experiments still being run.

However, it has also come to our attention that the CRTM team are fixing a bug in the coefficients for MSU radiances. Stream 1 won't assimilate these until July 1979, but the second stream will assimilate these immediately. The hold for the short runs will continue through next week, at which time the status of the update to these coefficients will be reevaluated. However, all indications are that the reanalysis should not proceed until these are included in the CRTM. This is an interesting development. We'll run some tests of the impact of the bug fix.

So, in the mean time, we can continue the processing of the Stream 1, and evaluate it along the way. Some results will be posted in the next couple days.

Sunday, February 10, 2008

Status Feb 10

One of the last few fixes included in the system (discussed in the previous update), one that should have been minimal impact, greatly affected some code in the data assimilation. The result was that many wind observations that should have been assimilated were not. The problem was apparent (actually the system crashed), so the fix has been fixed.

There have also been several down times in the last week while some updates were made to the computing platform. So far, it looks like the data stream starting in 1979 has been running continuously (or at least regularly) over the weekend. It is up to 15 JAN 1979 after starting on Friday in December 78. So, if all goes well, by Tuesday we should see the first month of MERRA data.

With all the down time, some short reprocessing experiments that the GMAO is producing for instrument team support have been delayed. So, there is a backlog that is being cleared out. Once clear, the second two streams will be restarted from Jan 1989 and Jan 1998, respectively.

Thursday, January 31, 2008

Status Feb 1

The three streams are ready to start. The first has run from Jan 1 1979 to Jan 9. However, all are on hold while system maintenance is being done (in other words, the computers are down).

By Monday, I'll be back from the 3rd International Conference on Reanalyses in Tokyo Japan, with better information. It has been a very interesting meeting, with status updates from the 20th Century reanalysis project and the NCEP CFS Reanalysis and Reforecast project (see the ppt at the CFS Site). Stay tuned to these interesting activities too!

Sunday, January 27, 2008

Status Jan 28

The three spinup runs reported earlier have completed 1 year of spin up. These have provided the starting points for the MERRA production. The output diagnostics have been updated to correct minor diagnostic bugs, and when the system is rebuilt, production will begin.

I'm monitoring status from the 3rd WCRP International Conference on Reanalysis, and will this page when new information is available.

Saturday, January 19, 2008

Status Jan 19

A data flag was out of place, and Stream 1 had to be backed up. All are still moving forward to the end of the December of their respective spin up phases.

Stream 1 date completed: 19781202

Stream 2 date completed: 19881124

Stream 3 date completed: 19971124

The at the end of December of each stream, the system will be rebuilt one last time.
While checking the output data, several minor bugs were found in the output, but nothing that changes the physics. A few other bugs have also been found, which may be non-zero in the physics. These are present being address, but none are considered to be significant changes to the results or validation of the system.

Generally, when the system is running 10 days of reanalysis are produced every day, from each stream. This may not add up with extrapolations from recent posts, because of computer downtime, or backing up the system.

Saturday, January 12, 2008

Status Jan 12

The Spin Up periods are still being processed.

  • Stream 1 RUNNING at 11/01/78
  • Stream 2 RUNNING at 09/26/88
  • Stream 3 RUNNING at 09/27/97
A group of GMAO folks have begun a final check of consistency between the output data files and the file specification document. The group will report back next Thursday.

Friday, January 4, 2008

Status Jan 4

Over the holidays, the last few science fixes went into the system, and the spinup periods resumed. Each of the three MERRA processing streams is presently running, with the data to be discarded for spinup.

  • Stream 1 RUNNING at 08/31/78
  • Stream 2 RUNNING at 07/30/88
  • Stream 3 RUNNING at 07/30/97
As a reminder, the planned start day for each stream is Jan 1, 1979, 1989 and 1998 respectively. They are moving at approximately 10 days per day, when the computer systems are up. They will hold at the end of each November, so that the last patch of the system (engineering fixes to the output diags, scripting and post processing that do not affect science) can be put into place. At that time, the GMAO will also make an evaluation of the output diagnostics, to ensure that the data and units all match the file spec document.

There is a known issue already becoming apparent. The CRTM coefficients for NOAA 8 AMSUA channel 14 have some problems. This data doesn't begin until May 1983, so there is time to correct the problem without affecting the MERRA production schedule. Further updates as the run get closer will be provided.

Happy New Year!

Wednesday, December 5, 2007

Reanalysis Precipitation Climatology

On the MERRA WWW page, we are posting several figures showing the comparison of 5 satellite era reanalyses with GPCP and CMAP precipitation data sets. There are some similarities among the reanalyses, in their differences from the observations (Tropical precipitation, and interestingly European continental January precipitation), but also differences between the merged observation data sets (GPCP has lower tropical precipitation than CMAP, but higher January precipitation, in general). Citations are provided on the page, that provide some analysis and discussion on the sources of bias. However, there are many other aspects in comparing reanalyses to the observed data. These are only climatologies, so that interanual variability, weather scale and diurnal cycle differences are not expanded.

The WWW page is at: http://gmao.gsfc.nasa.gov/research/merra/reanalysis_precipitation_climatology.php

Please take a look, and feel free to make comments on this blog.

Thursday, November 29, 2007

Status Nov 29

Just a brief post. The spinup runs are still on hold. The physics in the system seems to be set and the output diagnostics are likewise set. The main hold up is that the adaptive bias correction of a small number of channels over land is not stabilizing even after long (coarse resolution) runs, and continues to grow ultimately leading to the rejection of observations that should otherwise be accepted. A patch seems to be working, and a clean experiment is getting underway today. The spinup experiments should be restarted soon, and that will be posted here when it happens.

Tuesday, November 20, 2007

Summary of the MERRA User's Review Group Meeting

In late 2005 a MERRA review group was formed from experts in various aspects of Earth system science and users of existing reanalyses. Their charge was to review the GMAO strategy for MERRA and the validation experimentation and results, possibly contributing some of their own analysis. The goal for GMAO was to gain a preliminary assessment of the scientific merit of the GEOS-5 data assimilation system for MERRA prior to full production. In September 2007, the validation experiments began, and on November 7, the user review group met to discuss the results of the validation experiments with the GMAO and NASA HQ representatives.


The GMAO started the day, presenting a summary of the system and critical improvements in recent months (Rienecker), the dynamical circulation, clouds and radiation (Suarez and Bacmeister), climate variability features (monsoons, hurricanes, low level jets (LLJ) and diurnal cycle - Schubert) and precipitation statistics and land hydrology (Bosilovich and Koster). Key points from the presentations are summarized below.

Michele Rienecker reviewed some major and critical changes to the system since the inception of the Review Group. These include improvements in the use of retrieved wind speed over the ocean, improvement in the radiance assimilation (through the latest CRTM radiative transfer coefficients), corrections to bias and jumps in the radiosonde observations and a fix for diurnal cycle of glacier surface temperatures.

In looking at zonal circulation, Max Suarez showed the differences between the GEOS-5 and other reanalysis systems for winds, temperature and humidity. For example, the GEOS-5 eddy heights compare with ECMWF operational analysis both in a mean sense, and in the interannual variability. With small contour intervals in the zonal cross-sections, differences in tropopause height can be identified among all the reanalyses. In addition, GEOS-5 reproduction of stratospheric ozone profiles is reasonable, and a limited comparison of the beginning of a quasi-biennial oscillation looks promising. One possible systematic problem is high upper troposphere humidity (as compared to ECMWF and NCEP operational analyses). The radiation fluxes have some bias, as well, but these are somewhat reduced compared to the existing reanalyses (Figure 1).

Siegfried Schubert reviewed some evaluations of monsoonal circulations, including the North American monsoon and Indian monsoon. GEOS-5 reproduces the low level winds (e.g. the Somali jet and the Great Plains LLJ) as well as the subseasonal breaks observed in the monsoonal precipitation. There are some apparent regional biases in the precipitation, but this is also true among all the existing reanalyses. The GEOS-5 North American monsoon circulation and precipitation compare well with the North American Regional Reanalysis (NARR) (for July 2004, Figure 2). Globally, the interannual variations of precipitation compares well with observations, and better than existing reanalyses. In addition, the monthly average water budget shows globally averaged analysis tendencies to be a small value (Figure 3). However, the diurnal amplitude of continental precipitation is large and the phase is shifted to a daytime maximum compared to observations. This is a problem for all reanalyses, and it persists in the GEOS-5 system.

Mike Bosilovich reviewed monthly mean precipitation, where GEOS-5 generally produces good fields compared with GPCP and CMAP, not only in the global mean, but also spatial correlation. In addition global P-E is generally small (near zero) indicating that the global analysis is relatively well balanced (but will be non zero). The GEOS-5 precipitation is reasonable in many regions and latitude bands. Comparisons for the Mississippi River basin precipitation against daily gauge data show the GEOS-5 was able to produce the daily precipitation events, and the no-rain days for Jan-Oct 2004 (Figure 4). However, maximum intensities in the warm season are underestimated, leading to an underestimate of the total basin precipitation. Randy Koster’s analysis of the time series of precipitation shows that the occurrence of rain during the day coincident with solar forcing causes high interception loss of water vapor, and then the runoff water is underestimated. The transition of the observing system to include SSM/I was tested in a data withholding experiment. GEOS-5 tropical precipitation increases with the inclusion of SSM/I, but the increase is less than 10% of the tropical precipitation (in contrast, JRA25 has a change in extratropical precipitation). There is also a small increase of total column water, ocean surface winds and ocean evaporation.

The overall conclusion is that the GEOS-5 system can produce many aspects of the Earth system as well or better than existing reanalyses. The quality of the data coupled with the fine temporal and spatial scale of the data should make the GEOS-5 reanalysis useful for many purposes. While there were spirited discussions among all the participants, the external user group members’ sentiment reflects this conclusion as well. As of November 2007, the reanalysis data streams are being spun up, and data should start flowing to the scientific community early in 2008. The full MERRA data product will take approximately 18 months to generate.


Figure 1 Monthly mean (Jan 2004) TOA Longwave radiation differences between CERES ERBE-like observations and several reanalyses and operational analyses.

Figure 2 Comparison of the seasonal evolution of the North American monsoon between the North American Regional Reanalysis (NARR) and GEOS5.

Figure 3 Global vertically integrated water vapor budget for July 2004 including the physical components, the analysis increment and residual.

Figure 4 Mississippi River basin area-average (over all sub-basins) daily precipitation for January – September 2004. The figures show the scatter of the daily data, the daily time series, and the accumulated precipitation. The observations are CPC daily ¼ degree gridded gauge data.

Friday, November 9, 2007

Status Nov 9

The validation of the system has been somewhat time consuming between this post and the previous, and much has happened. At least 20 GMAO staff (or more) spent several weeks interogating the validation experiments each focusing on various Earth system components. On Oct 11, the GMAO held an internal review of the validation experiments. On Nov 7, the summary of these results were presented to our User Review group in a meeting at GSFC. My interpretation of the Review is that the system has more than enough scientific merit to proceed to production phase, weighing the advances and advantages against the limitations and some weaknesses. When any formal writing from the Review are made available for public posting, I'll put it on the blog. This is a significant milestone for the MERRA project and the GMAO.

There were many very positive results that came out of the MERRA validation experiments. Too many to easily synthesize into blog posts. A validation document is under development, but should take some time. Some results will be posted here as time goes on. In the near term, however, validation pointed out a serious flaw in the system. When the CERES science team evaluated the data, they found that Antarctica and glaciers did not have a diurnal cycle of surface temperature. The reason ended up being a thick glacier layer. Some new code, including a thinner layer and revisions to the energy budget code have produced very reasonable results. So, this fix will be added to the MERRA system. (see the Figure)

Figure: Time series of 2m air temperature at two Antarctica stations. The green line indicates GEOS5 Patch 15, Blue is patch 20 (including the fix) and the read is ECMWF operational analysis. Model data are the nearest gridpoint to the stations. Station data is marked with a black box.

So, the spin up of MERRA production runs are on hold until the system is updated. Some testing of convection parameterization coefficients has been going on through this process. A decision is pending on which, if any, will go into MERRA. The issue to be resolved are, updating the system with new glacier surface temperatures, finalizing the MERRA output routines and final evaluation of the convection parameterization. Spinup runs will restart once these issues are resolved.