Wednesday, June 9, 2010

Converting MERRA data to Grib2

Forwarded from Wesely Ebisuzaki:

Hi,

I wanted the MERRA dataset (HDF/GDS) in grib2 format so g2grb.gs
was written.
g2grb allows you to write grib2 files from grads.

Testers wanted:
requirements: latest version of wgrib2 installed
know grib2
send results to wesley.ebisuzaki at noaa.gov

instructions: http://www.cpc.noaa.gov/products/wesley/g2grb.html


Wesley Ebisuzaki

Wednesday, April 28, 2010

GEO on Continuing Reanalyses

GEO has published an article supporting the reanalyses development and international collaboration and coordination. Reanalyses represent a significant confrontation between the models and observations, and can be used to improve both, and produce a research quality value-added data product. While CFSR, Interim, 20CR and MERRA are all being released about the same time, they were not planned that way. So, there is a unique opportunity to have a community-wide check on our technological development in the models, assimilation, observations quality and computational resources (which affect the resolution and numerics). Generally, there will be advantages and disadvantages to each of these, which will take some time and effort to sort out. While they will be different, the important point will be is if they are making improvements on the representation of the Earth system.


In order to make progress, continuity and traceability in the system development will be crucial, but can only be attained if the respective centers have regular plans to produce the next round. If too many years go by, the next systems will be so different isolating and understanding the reasons for differences will not be possible. To little time, and the next reanalysis will not represent much difference, and the community will begin to feel the workload updating to the latest. Ideally, the next reanalyses should utilize all the information gained on the quality of the observations from the previous reanalyses, while advancing the representation of physical processes and data assimilation.


Tuesday, April 20, 2010

Effect of the Eyjafjallajokull eruption

Aircraft observations are a substantial part of the reanalysis system, especially over the oceans and regions where other high altitude conventional observations are infrequent. So that, the eruption of Eyjafjallajokull volcano will have many effects on reanalyses in general. Increased concentrations of aerosols can effect the remote sensing of atmospheric properties (Mount Pinatubo is the typical historical case). The aerosols will affect the radiance observations, and we will be monitoring MERRA's variational bias correction and assimilation of the radiance observations. It's also worthwhile to note that the MERRA system does not include interactive aerosols or aerosol assimialtion (currently under development), but rather incorporates only prescribed mean seasonal cycle variations.

The commercial aircraft restrictions that occurred also have affected the aircraft observing data set.The figures below show the number and locations of aircraft observations in a 6 hour window from ASDAR data system, before and after the major eruption that disrupted air travel.


It appears that the numbers of flights are beginning to recover, and the altitude of the eruption is on the order of 10km, so that the effects should be short lived, assuming the activity subsides.

Before: 12425 obs in 6 hours (green are used in the assimilation, red indicates qc rejection)
After: 6038 obs in 6 hours

MERRA real time production schedule

Stream three has finished March 2010, signifying a transition to real time production schedule. Production will lag real time by approximately 3 weeks, allowing collection of all the observations used in the retrospective periods. We are planning one week to review and quality assure each new month's data files, before being sent to the GES DISC. So, Each new month of MERRA data will be available online roughly 1 month behind present time, and will be released in 1 month segments.

Jan-Mar 2010 are currently being reviewed and should be available on the DISC within the next couple of days.

Wednesday, March 17, 2010

New Results: High Latitude Fluxes

There are a number of presentations that include MERRA data at the Workshop: Surface Fluxes: Challenges for High Latitudes in Boulder CO this week. Given the scarcity of observations at high latitudes and uncertainty in satellite observations, reanalyses may be useful data sets.

Michael Brunke, Xubin Zeng,( Uncertainties in global surface flux datasets in high latitudes.) compare various reanalyses and remote sensing products with tower and ship data from various field experiments (CATCH, FASTEX and SHEBA). The results show MERRA is much more comparable to the station data than the previous generations reanalyses, and in range of the remotely sensed products (e.g. Figure 1). The poster is available online.


Figure 1 Comparison of 6-hourly mean wind stress from MERRA, ERA-40, NCEP-R1, and NCEP-R2. The solid lines are the one-to-one slope and the dashed lines are the straight-line regressions with the regression slopes indicated.

Richard Cullather. Evaluation of Arctic Energy and Moisture Budgets in the MERRA Reanalysis. has also compared MERRA Arctic data with long term station measurements and some field experiment sites. For example, Figure 2 shows the time series of MERRA precipitation compared to observations made at a drift camp site. While there are some discrepancies in the magnitude of a few events, the comparison (and correlations of 0.74) seems quite reasonable given the uncertainties at high latitudes.

Figure 2 Drift Camp observed precipitation compared to MERRA. The points are 7 day running means over the period late 1987 through 1990 (a total of 1200 days).

In addition, there is:
J. Brent Roberts, Franklin R. Robertson, Carol Anne Clayson, Analysis of atmosphere-ocean surface flux feedbacks in recent satellite and model reanalysis products.

More on that later.

Full presentations will be posted online at the workshop site shortly after the conclusion.

Thursday, March 11, 2010

Update to Data Streams

We are updating MERRA data to permit longer spinup of streams 2 and 3. The announcement and how it affects data downloads follows. Data files formally available in the MERRA data streams are being renamed "SPINUP_*" and will also be available for download. Most research and applications for the data will only require use of the "Mainstream" MERRA data.

Updating of the MERRA data products site to contain only Mainstream data (http://disc.sci.gsfc.nasa.gov/mdisc/data-holdings/merra-mainstream-and-spinup-data) will begin Thursday, March 11, 2010. A two step procedure will be followed to achieve this. In step one, all current  products for the years 1989 through 1992 and 1998 through 2000 will be deleted. It is strongly advised that the MERRA data for the two aforementioned periods not be accessed until this data update is complete.  In step two,  
products will be used to repopulate these data years. We anticipate that it will take about two weeks to complete the data update. The remaining year
s of the data and all the MERRA data services will still be available during this time period. Once the update activities are completed, a new notification will be sent out and posted on the web. We thank you for your patience during this period. If you have any questions or concerns please send an email to the GES DISC User Services (help-disc@listserv.gsfc.nasa.gov).


So when the update is complete, Stream 1 will contain 1979 through 1992, Stream 2 will have 5 years spinup (4 available for download) containing 1993 through 2000, and stream 3 will have 4 years spinup (3 available for download) containing 2001 through present.

2009 data should become available during the week of March 15.

Tuesday, March 2, 2010

Update to Precipitation Validation

Precipitation is a reasonable metric for evaluating reanalyses, because it is coupled to both the water and energy cycles and will be affected by the heating and water vapor increments, as well as variations in the dynamic response of the system to the data assimilation. Bosilovich et al (2008) evaluated precipitation among reanalyses, and also included results from the MERRA validation experiments. Below is an update of some of the Taylor diagrams presented there, now including both MERRA and ERA Interim reanalyses. See Bosilovich et al. (2008) for more explanaiton and the original citations for Taylor diagrams. These are showing that both MERRA and Interim precipitation are close in skill, and ahead of the previous generations of reanalyses. NCEP CFSR will be included in the next version of this evaluation. This was presented in part at the last AMS Annual Meeting (presentation at AMS).


Monday, February 1, 2010

MERRA Turns 30

Data availability at the DISC now extends for thirty years 1979 through 2008. This data is all online, and open to access. Production is presently in May 2009, and so should catch up to real time around the end of February. MERRA will continue into the future, as long as it is feasible to do so. At this point, we do not have a set production terminus.

Friday, January 29, 2010

Arctic System Reanalysis

Recognizing the importance of the Arctic region, as well as the tremendous amount of field work and supporting data sets, the Arctic System Reanalysis will perform a high resolution limited domain reanalysis for the Arctic. Recently, there was a Call for Community Involvement (unfortunately AGU member can only download this), printed in EOS (v 91, #2, 12 Jan 2010) looking for supplemental data and science interest in the project.

There has been quite a bit of recent evaluations of MERRA polar energy and water cycles. Some will be posted here shortly.

Wednesday, January 27, 2010

Pressure levels greater than surface pressure

Some questions have come in regarding differences between MERRA and other reanalysis at pressure 1000mb and 850mb pressure levels. It is very important to note that MERRA does not extrapolate pressure level data vertically greater than the surface pressure. The result is that there is undefined data points in much of the 1000mb fields. This will affect the representativeness of both time and area averages of MERRA data compared with reanalyses or other data that extrapolates gridpoints to pressure levels greater than the surface pressure. The GMAO provides a summary of the impact that this has on averaging. In addition, the FAQ will be updated to call out this difference with other data sets. The main GMAO www page also has other pages with useful practical information about the data and assimilation system.

Friday, January 15, 2010

CFSRR

Some News which may interest those who read these pages:

On 1/14/2010 6:16 PM, Suranjana.Saha@noaa.gov wrote:
> Dear Colleagues
>
> I am happy to inform you that the CFS Reanalysis is now complete for 31
> years (1979-2009) and the paper has just been submitted to BAMS.
>
> You can download it at the CFS website at:
>
> http://cfs.ncep.noaa.gov
>
> The first set of CFSR data will be made available to the public at NCDC
> and NCAR on Feb 1, 2010. The complete high resolution datasets will be
> distributed in the next 6 months or so.
>
> Thanks
> Suru Saha

Wednesday, January 13, 2010

MERRA Turns 30

31DEC2008 has just been produced by the reanalysis system. This extends the MERRA Mainstream to 30 Years. 2008 is still being checked for quality, but should be posted online at the MDISC within a week or so.

At approximately 1 year per six weeks, 2009 should be produced by the end of February. MERRA production will make a transition then, where we expect data to be released monthly. The production is delayed from real time to allow ingest of the most complete observations, but also to quality check the data files.

Friday, January 8, 2010

1993 Flood

Hydrologic anomalies can be persistent leading to extreme regional conditions. Much has been written on the 1993 flood in the central United States. The soil was saturated at the start of the summer becasue of above normal spring precipitation. During June, several strong synoptic scale events brought continued wet conditions. During July at the center of the flooding rains, convective events occurred almost every day. This post is just a quick look at the MERRA anomalies. It is interesting to note that the magnitude of the heavy precipitation anomaly is weaker than what was observed by gage measurement (figure below). Likewise, the precipitation anomaly for 1988 (severe persistent drought) is also a smaller magnitude than observed (not shown).


The following figure shows the time series of MERRA and gage July-Aug (JJA) precipitation area averaged for the sub-basins of the Mississippi. The curious feature in this comparison is that the various sub-basins in MERRA tend to track similar to each other, or perhaps, more than the gage observations. This is apparent from the mid 1990s through the early 2000s. It seems that the spatial scale of precipitation anomalies in MERRA is larger than observed.

These features still need to be more thoroughly studied.

Thursday, December 24, 2009

Main stream and spinup data

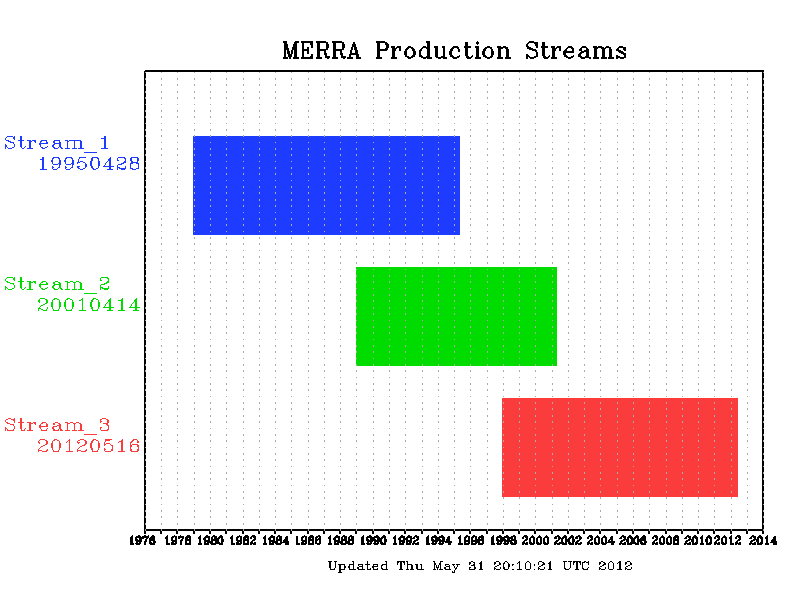
The original plan for MERRA production was to run in three streams, optimizing the computers processes. The original three streams were 1) 1979-1988, 2) 1989-1997 and 3) 1998-present. These were initialized with 2 years of coarse resolution analysis, followed by 1 year at the native (1/2 degree) resolution. Recently, streams 1 and 2 caught up to the beginning of the respective subsequent streams, connecting the time series. Streams 1 and 2 were continued providing overlapping data with the beginning of the next streams, in order to test the variance of the system and the viability of the initialization. At present, each of the overlapping periods are now 3 years duration (1989-1991, and 1998-2000).

We have been evaluating the initial conditions and the continued spinup of streams 2 and 3. In general, there are few differences in the meteorology between the overlapping data. In fluxes (such as precipitation), we do not a small difference at the beginning which gets smaller in time. The differences would likely not affect any scientific results. Slightly larger differences can be seen in slowly varying states, such as the root zone wetness.

At present we are documenting these differences and will provide a report on the overlapping period. In the mean time, this letter is provided to users to alert them that we will be changing the transition times of the streams to utilize the additional data produced at the ends of stream 1 and 2. This does not invalidate the data currently available, but is considered only a minor scientific revision. Once the data is provided to the DAAC and prepared for user access, the new streams and transitions will be as follows:

  • Stream 1 1979-1991
  • Stream 2 1992-2000
  • Stream 3 2001-present

Connecting these streams will be presented to users as the primary MERRA data, or the “main stream” data. Access to Stream 2 1989-1991 and Stream 3 1998-2000 data will still be provided, but the data will be considered secondary and called “spinup” data. This will effectively increase the spinup period for Streams 2 and 3 to 4 years of native resolution analysis.

We anticipate the transition from the original streams to this extended spinup configuration to occur in February 2010, nearly coincident with Stream 3 catching up to real time. Regular updates on this will be made after the holidays.

Have a wonderful Holiday Break!!


Wednesday, December 16, 2009

Accessing MERRA: Data Subsetter

This week, I needed a daily average surface flux subset of MERRA data. Locally, we have the 1 hourly data on a mass store system, but that is primarily archive, and not best used for routine analysis. The source data files are 269Mb each, and I needed one for each day from July 1987 through Dec 2007, which would have been a 2TB request. So, I used the MDISC to create data files specifically for the comparison from the Data Subsetter.

With the subsetter, I selected the 4 variables needed for the experiment, the time range (Jul1987-Dec2007, or 7489 days), the region could have been trimmed, but was left at the default (global). Daily averages, not the 1 hourly averages were preferable, so the the daily mean box was checked. HDF was suitable, so it was left at the default (as opposed to NetCDF, more formats may be added later). The subsetter provided a text file with the http links to the reduced data request. The links activate a program that does the subsetting and streams the requested data back. This text file is used as input to a Linux call to wget, which does the work of opening the http.

It took only about 16 hours (mostly over night), but the result was only 23Gb of disc space. The daily mean check box also saved me the time to process those daily means. Lastly, I did use the Mirador search to access and download one of the unaltered source data files, just to verify the variables and the daily averaging, and there was no difference between the Subset processed averages and daily averages computed manually.

The subsetter has evolved a lot over this past year, and additional functionality is planned. However, in it's present form, it should be a very useful tool in accessing MERRA data.

Friday, December 4, 2009

Water vapor feedback

An early decision in producing MERRA was to release data to the science community before the completion of the full time series, in the hopes that early analysis would provide insight to the data in a timely manner. In this months Journal of Climate, Dessler and Wong evaluate the water vapor feedback in the climate system using AR5 models, ERA40 and MERRA. The models and reanalyses all show consistent positive feedback (see the excerpt figure below). MERRA (point L in the figure) does show a bit more variability than the climate models (points A-J). A contributing factor to that variability may be a smaller number of years considered for MERRA, as the data was analyzed early in the production. Even so, the inclusion of MERRA in this research does help characterize the system and contribute to the understanding of its capabilities for climate research. At present, 1979 through Feb 2008 are approved for release at the MDISC data site.

Friday, November 13, 2009

Status and overlapping data

There was some scheduled downtime this week, and that slowed production, but December 2007 will be complete sometime this evening. 2007 data files are undergoing evaluation and should be released to the DISC next week, with 29 years of data available online.

Production on the first two streams continued an extra two years of data, giving three years of overlapping analyses for 1989-1991 and 1998-2000. The data at the end of the run should be much better spun up than that near the initialization, so those data are also going to be released at the DISC. Our evaluation of the overlaps and transition between data streams will be posted in time, as will documentation of the overlaps.

Friday, November 6, 2009

Katrina Quick Look

In looking at some land hydrology in the southern US, a question came up on the effect of the 2005 hurricane season on the hydrology time series. So, we started looking around at the evolution of Katrina. This animation shows the MERRA version of Katrina (13Mb gif) moving over the southern tip of Florida and through the Gulf of Mexico. The colors show precipitation in mm/day and the white contours are sea level pressure (contour interval 2mb). The Best Track location is plotted every six hours. Firstly, the MERRA closed low pressure follows the best track fairly well throughout the evolution. This is notable only in that while MERRA does assimilate observations every six hours, there is no relocating or bogusing routines involved with the analysis/forecast cycles.

The MERRA resolution (1/2 degree) is not fine enough to get at the mesoscale structures in hurricanes, and we see that in MERRA where the surface winds (not shown) only reach Category 2 on the Saffir-Simpson scale (observations and estimates of Category 5 occurred during Katrina). Likewise, the rainbands at a distance from the central low are not well defined. The animation shows a curious shift of the main rain fall from the southern quadrant to the north, as landfall occurs (see also the figure below). In trying to validate this, we found radar data at NCDC, presented is in the second plot below, which agrees with the MERRA distribution. However, and also likely related to the resolvable scales in the MERRA grid, the heaviest precipitation in MERRA is a larger distance away from the central low than observed.

While this seems like it is a reasonable representation of the real system, and likely useful, users must consider carefully the limitations in MERRA or any reanalysis data set when applying it to a project.


Figure 1. MERRA precipitation (color, mm/day) and sea level pressure (mb) at 12Z29AUG2005 with the complete NHC best track path for Hurricane Katrina.

Figure 2 Nexrad radar rainfall at 12:32Z29AUG2005.

Tuesday, October 20, 2009

MERRA, MAC and LandFlux

In a recent paper, Bosilovich et al. (2009) evaluate 8 operational analyses to better assess the uncertainty of the physical fields (not the assimilated states) derived form (re)analysis systems. During the first phase of the Coordinated Enhanced Observing Period (CEOP) 8 international meteorological analyses were collected for a common period, along with supporting satellite and in situ observations. The model data is called the Multi-model Analysis for CEOP (MAC). In general, it was found that the global precipitation and outgoing long wave radiation derived from an ensemble of analyses provided fields that more closely resemble available observations than any one of the members.

For certain physical quantities, such as surface evaporation, a reliable method of observation is not available, and international projects such as SeaFlux and LandFlux are being developed to best fill the gap. In some research, data from analyses and reanalyses are taken as a substituted for observations. The figure below shows the MAC ensemble members compared with the ensemble mean. In places, there is as much as +/- 75 W/m^2 differences among systems. Comparison with such a data set can clearly identify outlying systems. Also, for certain research, using the physical fields from a single system may not be adequate.
Caption: MAC version 2 systems Latent Heat Flux differenced from the ensemble mean for July 2004. Version 2 includes the MERRA and ECMWF ERA Interim reanalyses in addition to the version 1 data. Mean and standard deviation of the difference fields are provided in each panels title.

More information on MAC and the data download are available.

Bosilovich, M.G., D. Mocko, J.O. Roads, and A. Ruane, 2009: A Multimodel Analysis for the Coordinated Enhanced Observing Period (CEOP). J. Hydrometeor., 10, 912–934.

Tuesday, October 13, 2009

Status and some recent analysis

Data at the download site are now continuous from 1979 through December 2006. To date, the data volume is approaching 70Tb, and in September alone, 5.7 million files totaling 91Tb of data were served.

Production continues toward real time, and June 2007 is halfway complete. The throughput is approximately 1 year every 6 weeks, so the production should catch up to real time in early 2010.

An overview of MERRA, including some recent results were presented at Purdue University Department of Earth and Atmospheric Sciences. This includes some evaluation of the global water and energy clycles and processes, however, the analysis continues and a peer review manuscript is in preparation. So, use these results accordingly.